BACKGROUND
Basic psychological need theory, one of the mini-theories of self-determination theory, assumes that three psychological needs are fundamental to human functioning: autonomy, competence, and relatedness (Deci & Ryan, 2000; Ryan & Deci, 2017). These needs are defined as “innate psychological nutriments that are essential for ongoing psychological growth, integrity, and well-being” (Deci & Ryan, 2000, p. 229). These needs are universal, meaning they are independent of culture (Chen et al., 2015).
The need for autonomy relates to the experience of volition. Its satisfaction is associated with a sense of integrity as well as authenticity and self-approval of behaviors, thoughts, and emotions. It is frustrated when an individual experiences internal conflict, pressure, over-control, or restraint. The need for competence relates to the sense of self-efficacy in interactions with the environment. It becomes satisfied as one experiences opportunities for using and extending skills and frustrated when one experiences ineffectiveness, failure, and helplessness. The need for relatedness relates to the experience of warmth, closeness, and caring in relationships with others. It is satisfied through close relationships and a sense of importance to others. Its frustration is synonymous with loneliness, exclusion, and social alienation (Vansteenkiste & Ryan, 2013; Vansteenkiste et al., 2020). The satisfaction or frustration of these needs is contingent upon the environment in which an individual functions. The environment can either support or thwart the individual’s needs (Ryan & Deci, 2017; Vansteenkiste & Ryan, 2013; Vansteenkiste et al., 2020). According to the theory, satisfaction and frustration are not the ends of one dimension but are two dimensions with an asymmetric relationship. Failure to satisfy the needs does not necessarily mean their frustration, but frustration is clearly related to the failure to satisfy them (Vansteenkiste & Ryan, 2013).
CONSEQUENCES OF NEED SATISFACTION AND FRUSTRATION
The satisfaction of basic psychological needs is linked with positive consequences, such as intrinsic motivation, integration, well-being, and health (Deci & Ryan, 2000; Ryan & Deci, 2017; Vansteenkiste & Ryan, 2013). Previous research shows the importance of satisfying needs across various areas, such as education (Tian et al., 2014), sport (De Francisco et al., 2018), and work (Van Den Broeck et al., 2008). Need satisfaction is associated with higher self-esteem (Ümmet, 2015) and life satisfaction (Kuźma et al., 2020), and a lower level of cortisol (Quested et al., 2011). It is also a protective factor against suicidal intentions and behaviors (Britton et al., 2014). The satisfaction of needs determines the cognitive appraisal of stress (Weinstein & Ryan, 2011; Yeung et al., 2016), thus influencing the actions undertaken in a stressful situation. Autonomy may be perceived as a resilience factor. Autonomous individuals regulate their behavior based on their authentic preferences, are less defensive, and less often make self-handicapping excuses to protect their self-worth (Hodgins et al., 2006; Vansteenkiste & Ryan, 2013). In contrast, low need satisfaction is associated with increased perceived stress and its negative consequences, such as sleep problems (Campbell et al., 2018) as well as higher levels of anxiety, depression, and negative affect (Ng et al., 2012).
Need frustration, i.e. active thwarting of basic psychological needs, can lead to many negative consequences for the individual. Compared to the lack of satisfaction, it does this actively, accelerating the emergence of adverse effects. The primary consequence of frustration is ill-being (Cordeiro et al., 2016). Need frustration is also associated with stress (Campbell et al., 2018; Ntoumanis et al., 2009; Weinstein & Ryan, 2011), depressive symptoms (Chen et al., 2015; Kuźma et al., 2020), psychological pain, alcoholism (Tabiś et al., 2021), symptoms of eating disorders (Verstuyf et al., 2013), and many other negative consequences. Frustrated individuals may look for need substitutes and engage in compensatory behaviors, which may take on the form of a loss of self-control, oppositional defiance, and rigid behavioral patterns (Vansteenkiste & Ryan, 2013). These consequences may lead individuals to specific, maladaptive ways of coping.
INDIVIDUAL NEEDS PROFILES
One suggestion made by the authors of the theory for further research on the basic psychological need theory is to adopt a person-centered perspective. This approach involves identifying individual profiles of satisfaction and frustration of basic psychological needs, analyzing interpersonal differences in this area and their importance for the functioning of individuals (Vansteenkiste et al., 2020). Previous studies have hinted at the existence of different profiles in specific groups of respondents (Rouse et al., 2020; Vanhove-Meriaux et al., 2017; Warburton et al., 2020). The profiles revealed in the studies, despite the difference in their number, confirm the asymmetric relationship between the satisfaction and frustration of needs. When frustration is high, satisfaction is usually low (Vansteenkiste & Ryan, 2013).
Previous studies have shown that individuals characterized by higher satisfaction and lower frustration of needs function in the most adaptive ways, while those with high frustration and low satisfaction tend to have negative outcomes. For example, elderly individuals with high satisfaction and low frustration, compared to the group with average levels of satisfaction and frustration, showed higher well-being, vitality, self-esteem, and positive affect, as well as lower negative affect and fewer depressive symptoms (Vanhove-Meriaux et al., 2017). Similarly, athletes with high satisfaction and low frustration, compared to those whose needs were unsatisfied and frustrated, had higher well-being, enjoyed training more, and exhibited fewer burnout symptoms. Students with satisfied and unfrustrated needs displayed more intrinsic forms of motivation than their unsatisfied and frustrated peers (Warburton et al., 2020). Similar results were obtained in a study of firefighters. Groups with high satisfaction and low frustration need profiles exhibited lower levels of stress, anxiety, and depression, as well as higher levels of life satisfaction (Rouse et al., 2020).
Basic psychological need theory highlights the importance of the satisfaction and frustration of psychological needs in the experience of stress and (mal)adaptive functioning. It has been proposed that need satisfaction may be treated as a resource, while need thwarting may act as a deficit in the coping process (Ntoumanis et al., 2009). However, to our knowledge, no research has examined how different groups with specific need profiles differ in terms of stress and coping. A person-centered approach (considering both satisfaction and frustration and their specific combinations) may provide insight into how individuals with different need profiles experience stress, cope, and attain satisfaction with life.
PURPOSE OF THE PRESENT STUDY
This study was carried out from the perspective of individual differences revealed through interpersonally differentiated need profiles. It aimed to investigate the differences in experiencing stress, coping, and satisfaction with life among young adults with specific profiles of satisfaction and frustration of basic psychological needs. To achieve this, we identified groups of people with specific profiles of satisfaction and frustration of needs. Then, we compared them in terms of perceived stress, the cognitive appraisal of a stressful situation, coping styles, and life satisfaction.
Firstly, according to previous studies (Rouse et al., 2020; Vanhove-Meriaux et al., 2017; Warburton et al., 2020), we expected to distinguish in the sample at least two groups of participants with specific need profiles: (1) high satisfaction and low frustration, and (2) low satisfaction and high frustration. However, we hoped to distinguish more profiles with specific combinations of needs. Only a combination of high satisfaction and high frustration was not expected due to their theoretical asymmetric relation (Vansteenkiste & Ryan, 2013). Secondly, it was expected that there would be significant differences in perceived stress, cognitive appraisals of stressful situations, coping styles, and life satisfaction between groups with different need profiles. It was predicted that frustrated and unsatisfied individuals, compared to satisfied and unfrustrated ones, would perceive a higher level of stress, appraise the stressful situation more strongly in terms of threat and harm/loss, show more frequent escape-avoidance coping style, and have lower life satisfaction. It was also expected that the cognitive appraisal of stressful situations as a challenge and the use of a problem-focused style would be more frequent in the group characterized by higher satisfaction and lower frustration of needs. We also expected to find appropriate differences in stress appraisal, coping, and satisfaction with life between individuals with other specific combinations of needs.
PARTICIPANTS AND PROCEDURE
PARTICIPANTS
Out of 626 people who took part in this study 622 fully completed the questionnaires (42.6% women). The participants were aged from 18 to 40 (M = 22.22 ± 4.30). The majority had completed secondary education (74.92%), lived in a large city (59.81%), and were single (46.62%) or in an informal relationship (45.66%). The data were collected using the paper-and-pencil methods by trained psychology students among volunteering Polish young adults (age criterion from 18 to 40 years old). Participation in the study was completely voluntary and anonymous. Informed consent was obtained from all participants.
MEASURES
Need satisfaction and frustration. Basic Psychological Need Satisfaction and Frustration Scale (BPNS&FS) by Chen et al. (2015) in the Polish adaptation by Tabiś et al. (2021). This 24-item method measures the satisfaction and frustration of autonomy, competence, and relatedness separately (each subscale with 4 statements). The answers or statements refer to the current life situation and are given on a scale from 1 (completely untrue) to 5 (completely true). The higher the result on a subscale is, the stronger is the satisfaction or frustration of the need.
Perceived stress. Perceived Stress Scale (PSS-10) by Cohen et al. (1983) in the Polish adaption by Juczyński and Ogińska-Bulik (2009). The tool refers to the cognitive-transactional understanding of stress and measures its generalized perception. Individual statements concern the assessment of life requirements as uncontrollable, unpredictable, or overloading and the emotions they cause. The questionnaire contains ten questions on the frequency of cognitive and emotional stress responses during the last month, with a response scale from 0 (never) to 4 (very often). The higher the score is, the stronger is the perceived stress.
Cognitive appraisals. Stress Appraisal Questionnaire [Kwestionariusz Oceny Stresu] (KOS-B) in the version for measuring dispositional cognitive appraisal (Włodarczyk & Wrześniewski, 2010). The method consists of 35 items (emotion names), of which 23 are diagnostic, and 12 act as a buffer. The questionnaire measures four types of cognitive appraisal: threat (9 items), harm/loss (4 items), challenge-active (5 items), and challenge-passive (5 items). Participants answer questions on how they usually perceive a stressful situation by responding to the list of emotions felt in such a situation, using a response scale from 0 (completely untrue) to 3 (completely true). The higher the score is, the stronger is the tendency to formulate a type of appraisal of a stressful situation.
Coping styles. Coping Orientation to Problems Experienced (COPE) by Carver et al. (1989) in the Polish adaptation by Juczyński and Ogińska-Bulik (2009) in the version for the examination of dispositional coping. The questionnaire measures 15 coping strategies and their factor analysis allows them to be categorized into coping styles. COPE examines reactions to difficult situations. Participants respond to the statements on a four-point scale, from 1 (I usually don’t do this at all) to 4 (I usually do this a lot), answering the question on how they usually behave in a stressful situation. The higher the score is, the stronger is the tendency to use a given coping strategy.
In our study, some COPE items obtained low or negative item-total correlations (for example, in the subscale of active coping, item 47 correlated with r = −.11, and in the subscale of suppression of competing activities, item 15 correlated with r = .28), so it was decided to remove the weakest and inadequate correlating items from all 15 scales. Ultimately, each subscale consisted of three instead of four items. Exploratory factor analysis was carried out on the subscale results, which allowed for the categorization of strategies into coping styles. This led to the identification of factors that were theoretically sensible, but not present in the initial version of the scale (Juczyński & Ogińska-Bulik, 2009) (see Table 1).
Table 1
Exploratory factor analysis of COPE results and subscales’ reliability
Satisfaction with life. Satisfaction with Life Scale (SWLS) by Diener et al. (1985) in the Polish adaption by Juczyński (2001). This short questionnaire is designed to measure a sense of life satisfaction. It is made up of five statements, to which the individual responds on a scale of 1 (strongly disagree) to 7 (strongly agree).
The measures described above were preceded by an introduction, consent to participate, and an answer sheet containing questions about sex, age, education, marital status, and place of residence. The internal consistency of Cronbach’s α is presented in Table 2.
Table 2
Descriptive statistics, reliability, and correlations of variables
DATA ANALYSIS
Data analysis was carried out using the TIBCO Software Statistica v.13.3, IBM SPSS Statistics, and R with the tidyLPA package (Rosenberg et al., 2018). For the COPE questionnaire (Carver et al., 1989), exploratory factor analysis was done using principal component analysis with varimax rotation. The Kaiser criterion was used to determine the number of factors measured by COPE. Cronbach’s α internal consistency index was used to assess the reliability of all the measures. The relationships between the studied variables were analyzed using Pearson’s r correlation coefficient. After standardizing the results of the BPNS&FS scales, the latent profile analysis was carried out to distinguish groups of individuals with specific profiles of need satisfaction and frustration. Statistical indicators were combined to determine the optimal number of profiles: Akaike information criterion (AIC; an information criterion based on the loglikelihood and the number of parameters), Bayesian information criterion (BIC; an information criterion based on the loglikelihood of a model, the number of parameters, and sample size) and its graphical plot (elbow criterion), the entropy, bootstrapped likelihood-ratio test (BLRT) significance (a nested model test that compares neighboring models). The model with the lowest AIC and BIC values offers the best fit. Higher entropy indicates better model fit. Lack of significant (p > .05) BLRT for a model with k + 1 profiles suggests that the solution is not superior to a k profile solution (for a detailed description of the indicators used, see Spurk et al., 2020). Multivariate analysis of variance was used to analyze the differences between the profiles in terms of stress, coping, and satisfaction with life.
RESULTS
PRELIMINARY ANALYSES
Factor analysis of COPE. Exploratory factor analysis identified five coping strategy factors. This solution explained 65% of the variance. The obtained factor structure of the COPE inventory in our sample is presented in Table 1.
The first factor includes the following strategies: active coping, planning, suppression of competing activities, and restraint (Carver et al., 1989). Based on the content analysis, this factor was identified as a problem-focused coping style. This style includes strategies that enable an individual to actively confront the problem, such as setting aside less important actions, preparing for action, and then taking immediate steps to resolve difficulties.
Scales such as the use of instrumental and emotional social support as well as focus on and venting of emotions (Carver et al., 1989) loaded the second factor, called emotion-focused coping style. Individuals using this style are motivated to cope with the distress caused by a difficult situation. They seek understanding and compassion from others as well as advice and support.
The third factor, named meaning-focused coping style, included the following strategies: positive reinterpretation and growth, acceptance, and humor (Carver et al., 1989). These forms of coping involve cognitive efforts aimed at changing the individual’s perception of a situation. Depending on the situation, these strategies can help an individual to change their approach to the problem or manage difficult emotions.
Denial, mental disengagement, behavioral disengagement, and substance use (Carver et al., 1989) loaded the fourth factor, called escape-avoidance coping style. People use these strategies not to constructively manage the situation and their emotions, but to avoid them, to escape from thinking about problems, and to remove themselves from a current stressor. This coping style provides immediate but temporary relief and may result in negative consequences in the long term.
The fifth factor, named religious coping style, was loaded by only one strategy, turning to religion, which fulfills different functions; for example, it might serve as emotional support. For detailed descriptions of these strategies see Carver et al. (1989).
Correlation analysis. Satisfied needs were positively correlated with each other, as were frustrated needs. The correlations between need satisfaction and frustration were negative and small to moderate, but not strong, providing support for the discrimination between satisfaction and frustration. Satisfied needs correlated positively with the appraisal of the situation as a challenge (both active and passive), problem-focused and meaning-focused coping styles, and satisfaction with life. Perceived stress, appraisals of the situation as harm/loss and threat, emotion-focused and escape-avoidance coping correlated negatively with need satisfaction, mainly autonomy and competence (emotion-focused coping only with relatedness satisfaction). Frustrated needs correlated with dependent variables similarly, but these relationships were reversed. The exact correlation coefficients and descriptive statistics are presented in Table 2.
PRIMARY ANALYSES
Identification of need satisfaction and frustration profiles. We investigated the fit statistics for solutions with two to ten profiles (with equal variances and covariances set to zero, Table 3). First, we rejected models with profiles of less than 3% of participants (solutions with 7 and more profiles). The elbow plot showed that the improvement in fit reaches a plateau at 5 profiles. Finally, we chose a solution with 5 profiles (Figure 1). A one-way MANOVA was carried out to test whether the need satisfaction and frustration scores differed across profiles. The results showed a significant effect of profile membership, F(24, 2136) = 109.22, Pillai’s trace = 1.55, p < .001, η2partial = 0.39. Autonomy, competence, relatedness need satisfaction and frustration differed significantly (p < .001) as a function of profile. These results provide support for the distinctiveness of the five profiles. Table 4 contains (in the upper part) means, standard deviations, standardized scores of basic psychological needs across profiles, and group comparisons.
Table 3
Fit indices, entropy and model comparisons estimated for the latent profile analysis solutions
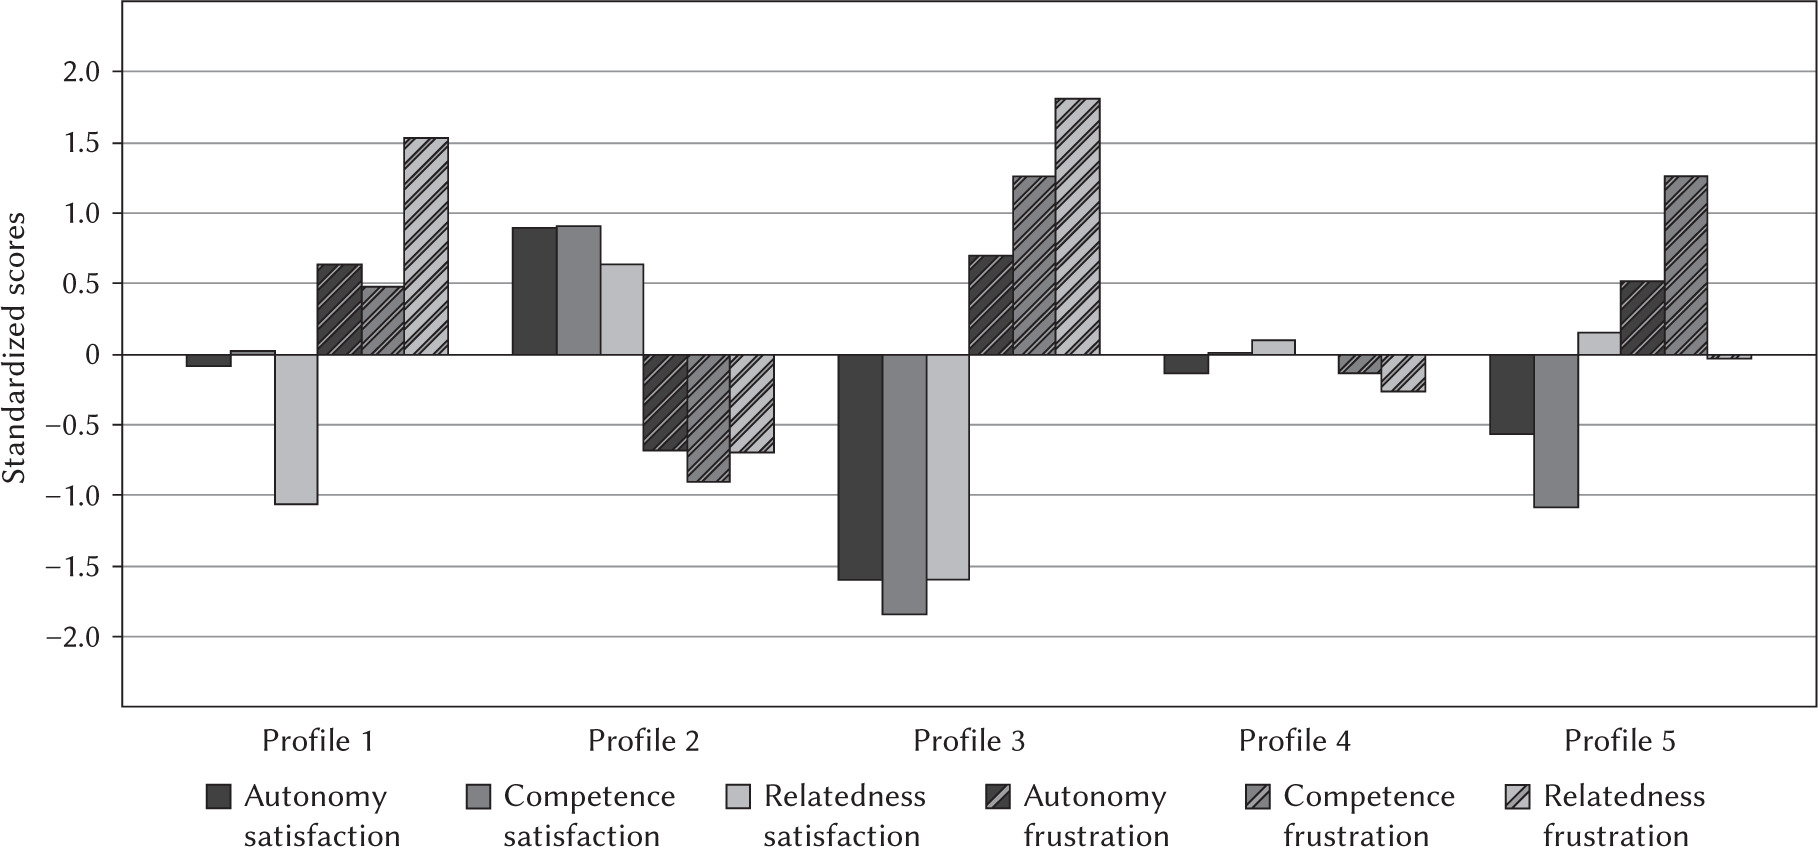
Table 4
Means, standard deviations, standardized scores, and profile comparisons, N = 622
The following description of the profiles refers to the differences between them, not to objective values. Participants with profile 1 (12.7% of the sample) had low satisfaction (< –1 SD) and very high (> 1.5 SD) frustration of relatedness, average satisfaction (± 0 SD), and rather high frustration (± 0.5 SD) of autonomy and competence. Individuals with profile 2 (26.5% of the sample) had high satisfaction (> 0.5 SD) and low frustration (< –0.5 SD) of all needs. Participants with profile 3 (6.8% of the sample) had very low satisfaction (< –1.5 SD) of all needs, and high frustration of autonomy (> 0.5 SD), competence (> 1 SD), and relatedness (> 1.5 SD). Individuals with profile 4 (42.4%) were characterized by average need satisfaction and frustration (> –0.3 SD and < 0.3 SD). Individuals with profile 5 (11.6% of the sample) had low satisfaction (< –0.5 SD) and high frustration (> 0.5 SD) of autonomy, very low satisfaction (< –1 SD) and very high frustration (> 1 SD) of competence, and average satisfaction and frustration of relatedness (> –0.3 SD and < 0.3 SD).
Differences in need profiles. We conducted χ2 tests to determine whether profile membership differentiates people in sociodemographic variables. Significant differences among profiles were found for marital status and education level. The proportions of subjects in the groups were compared (z-test with an adjusted p-value using the Bonferroni method). The groups differed only in the proportions of participants with below-middle education (the group with profile 4 had a significantly lower proportion of people with such education than the group with profile 3) and singles (the group with profile 3 had a significantly higher proportion of singles than the groups with profiles 2 and 4). There were no significant differences in sex, age, and size of place of residence.
To examine the effects of profiles on dependent variables a one-way MANOVA was performed. There was a statistically significant difference in dependent variables based on need profiles, F(44, 2320) = 9.97, Pillai’s trace = 0.53, η2partial = 0.13. To show differences between unequal groups we used Games-Howell post hoc tests. Table 4 (in the lower part) shows differences between groups of individuals with specific profiles of need satisfaction and frustration in terms of dependent variables. Differences between groups with large effect sizes were demonstrated for perceived stress (η2partial = 0.28), satisfaction with life (η2partial = 0.28), escape-avoidance coping style (η2partial = 0.19), and tendency to appraise the situation as a threat (η2partial = 0.15). Other differences between profiles had smaller size effects or were not significant (specifically, emotion-focused and religious coping styles).
Participants with profile 1 (mainly low satisfaction and high frustration of relatedness) perceived a moderate level of stress – higher than the group with profile 2, but lower than groups with profiles 3 and 5. They more strongly tended to appraise the stressful situation as a harm/loss than the group with profile 2 (but similar to other groups), and – in comparison to groups with profiles 2 and 4 – had a stronger tendency to appraise the situation as a threat and to use escape-avoidance coping. These individuals more strongly than the group with profile 5, but also more weakly than the group with profile 2, appraised the situation as a challenge-active. In terms of appraisal of the stressful situation as a challenge-passive, they differed only from the group with profile 5 – they had a stronger tendency to appraise the situation in this way. This group was more satisfied with life than the group with profile 3 but less satisfied than the groups with profiles 2 and 4.
Individuals with profile 2 (high satisfaction and low frustration of all basic needs), in comparison to other groups, perceived the least stress, had the weakest tendency to appraise the stressful situation as a harm/loss or threat, and had the strongest tendency to appraise it as a challenge. They had the strongest tendency to use problem-focused coping (similar to the group with profile 1) and the weakest to use escape-avoidance coping strategies. These participants were the most highly satisfied with life.
Participants with profiles 3 (low need satisfaction and high need frustration) and 5 (competence and autonomy low satisfaction and high frustration), in comparison to other groups, perceived the strongest stress. They tended to appraise the stressful situation as a harm/loss (similar to groups with profiles 1 and 4) and threat (similar to group with profile 1). These people tended to cope by escape and avoidance the strongest (similar to individuals with profile 1) and coping by changing the meaning of the situation the least. Participants characterized by these profiles were the least satisfied with life. Mainly individuals with profile 3 demonstrated a relatively low tendency to cope using problem-focused style.
Individuals with profile 4 perceived stress more strongly than the group with profile 2, but more weakly than participants with profiles 3 and 5. Compared to the group with profile 2 they more strongly tended to appraise the stressful situation as a harm/loss. These participants more strongly than individuals with profile 2, but more weakly than individuals with profiles 1, 3, and 5, appraised the situation as a threat and preferred the escape-avoidance coping style. They tended to appraise the situation as a challenge (both active and passive) more strongly than the group with profile 5, but more weakly than the group with profile 2. Those in this group were less satisfied with their lives than individuals with profile 2, but more than individuals with profiles 1, 3, and 5.
DISCUSSION
The study aimed to investigate the role of basic psychological need satisfaction and frustration for experiencing stress, coping, and satisfaction with life among young adults from the perspective of individual differences. Previous studies using the COPE or brief COPE (Carver, 1997; Carver et al., 1989) identified various factors of coping strategies depending on the group studied (as well as the difference between religious coping and other strategies) (Kallasmaa & Pulver, 2000; Kimemia et al., 2011; Litman, 2006; Pang et al., 2013). However, the reliability analysis of the COPE Inventory did not yield satisfactory results in this study. For this reason, we conducted an exploratory factor analysis of COPE results. As a result of the exploratory factor analysis a five-factor solution was obtained, one of the factors consisting solely of religious coping. Coping by turning to religion has various functions (Pargament, 1997) that COPE does not measure. In further research a wide range of religious coping strategies should be included. The factors, although different from those distinguished by the authors of the Polish adaptation of this questionnaire (Juczyński & Ogińska-Bulik, 2009), were theoretically consistent (Endler & Parker, 1990; Folkman & Moskowitz, 2007; Lazarus & Folkman, 1984). Importantly, the exploratory factor analysis distinguished the escape-avoidant style, which, if used inflexibly, can lead to negative consequences (Taylor & Stanton, 2007).
The next step in the analysis was to identify groups of people with individually differentiated profiles of satisfaction and frustration of basic psychological needs. Latent profile analysis revealed five profiles with specific combinations of basic psychological needs satisfaction and frustration. Our results (see Figure 1) confirm that the relation between need satisfaction and frustration is asymmetric (Chen et al., 2015; Vansteenkiste & Ryan, 2013). As expected, when need satisfaction or need frustration was high, the opposite tended to be lower. However, both satisfaction and frustration can have average scores simultaneously. Furthermore, average need satisfaction may coexist with high need frustration (Vansteenkiste & Ryan, 2013).
The obtained results are consistent with the assumptions of the basic psychological need theory (Ntoumanis et al., 2009; Vansteenkiste & Ryan, 2013; Weinstein & Ryan, 2011). People with satisfied and unfrustrated needs experience significantly less stress, cope more constructively in stressful situations (Quested et al., 2011), and are more satisfied with life (Chen et al., 2015). In contrast, those frustrated and unsatisfied with these needs are more stressed, prone to rely on escape-avoidance coping strategies, and generally have the lowest life satisfaction.
Furthermore, the results showed specificity of need profiles. For example, a comparison of groups with profile 1 (participants with relatedness frustration and dissatisfaction), profile 3 (low satisfaction, high frustration), and profile 5 (competence and autonomy frustration and dissatisfaction) indicates that frustration of any need may lead to negative consequences, even when others are not frustrated. However, the nature of these consequences depends on which need is frustrated. These groups did not differ in terms of most coping styles and appraising the stressful situations as harm/loss or threat. However, individuals with profile 1 were more satisfied with their lives than those with profile 3, more likely to appraise situations as a challenge than the group with profile 5, and perceived significantly less stress than groups with profiles 3 and 5. These results show specific differences between participants with various combinations of satisfaction and frustration of autonomy, competence, and relatedness (compare with Rouse et al., 2020; Vanhove-Meriaux et al., 2017; Warburton et al., 2020).
Our results suggest that need satisfaction and frustration are related to experiencing stress, coping, and its outcomes, such as satisfaction with life (Lazarus & Folkman, 1984). These relationships can be explained by several mechanisms. Need satisfaction can serve as coping resources and resiliency factors that alter cognitive appraisal and coping (Ntoumanis et al., 2009; Vansteenkiste & Ryan, 2013). Maladaptive coping can be a result of chronically frustrated needs, leading to external regulation, oppositional defiance, loss of self-control, or rigid behavioral patterns. A frustrated individual is not intrinsically motivated to deal with problems constructively, easily succumbs to quick gratifications, and compulsively sticks to known and safe behaviors (Vansteenkiste & Ryan, 2013). This explains especially the tendency for avoidance and escapism, for example by using alcohol (Tabiś et al., 2021) or problematic game playing (Chamarro et al., 2020). An interesting finding is that the groups differed strongly in terms of the escape style but less or not at all in the other styles. It is important to note that only one group with satisfied needs and three groups characterized by frustrated needs were specified.
Several limitations of the present study need to be addressed. Firstly, some psychometric values of the COPE inventory are weak. In the future, it is worth using a different questionnaire to measure coping styles and take into account various religious coping strategies. The surveyed group consists mainly of young people with secondary education and singles, so it is not representative. Future research should include other age groups and larger samples to identify other, specific combinations of needs. In our study, only one group had high need satisfaction. It is important to study other specific profiles with different levels of satisfaction and frustration of needs. The study design does not allow for cause-and-effect inference. Hence, confirmation of the importance of individual profiles of satisfaction and frustration of needs requires further research in a longitudinal model.
CONCLUSIONS
Individualized profiles of basic psychological need satisfaction and frustration are related to perceiving stress, cognitive appraisals, coping styles, and satisfaction with life. Need satisfaction and lack of frustration favor adaptive coping. Individuals with such a profile appraise a situation as a challenge, use problem-focused coping, and are more satisfied with their lives. Conversely, lack of need satisfaction and its frustration are linked with appraising stressful encounters as harm/loss and threat, escape-avoidance coping, and lower life satisfaction. Need satisfaction and frustration may be treated as important resources or deficits in coping processes. In conclusion, it is important to consider individualized profiles of need satisfaction and frustration in understanding the coping process and to apply interventions targeted at specific needs.