BACKGROUND
Every year, hundreds of millions of people around the world experience ailments associated with low back pain, which ranks first in terms of conditions with the highest number of years lived with disability (YLD) and sixth in terms of disability-adjusted life years (DALY; Hoy et al., 2014). This disease is one of the leading causes of a reduction in the quality of life (McMahon et al., 2013; Woolf & Pfleger, 2003) and is also the most common cause of absence from work (Wynne-Jones et al., 2014). Because of its chronicity and impact on many aspects of life, it is not only a medical problem, but also an economic, social, and psychological one (e.g. Jonsson et al., 2016). Research has shown that a variety of methods, such as rehabilitation programs, back pain education, exercise, surgical interventions, and pharmacology, are effective in improving patients’ performance and coping with their symptoms. Unfortunately, regardless of the method used, the reduction of symptoms in people experiencing nonspecific low back pain is miniscule in the long term, as indicated by the results of a systematic review (Artus et al., 2010). One hypothesis explaining the modest long-term improvement in the chronic low back pain group is a lack of focus on psychological factors, thus overlooking an important element of the holistic model (Pincus et al., 2013). Psychological factors may play a role not only in shaping quality of life, but also in the development of the disease itself (Alhowimel et al., 2018). For example, fear of pain can lead to inappropriate avoidance of activities, such as physical or social activities, which can lead to a lack of improvement and a reduction in quality of life. Second, understanding a person’s personal experience can lead to an improvement in the rehabilitation process by revealing the problems and wide-ranging consequences of the disease that affect the patient. Thus, they help better understand the disease itself and predict its consequences and factors that facilitate and hinder treatment (Haraldstad et al., 2019). Third, in the case of low back pain, there is not a very strong relationship between medical indicators and the subjective perception of symptoms, along with the degree of disability (Pincus et al., 2013).
AIM OF THE STUDY
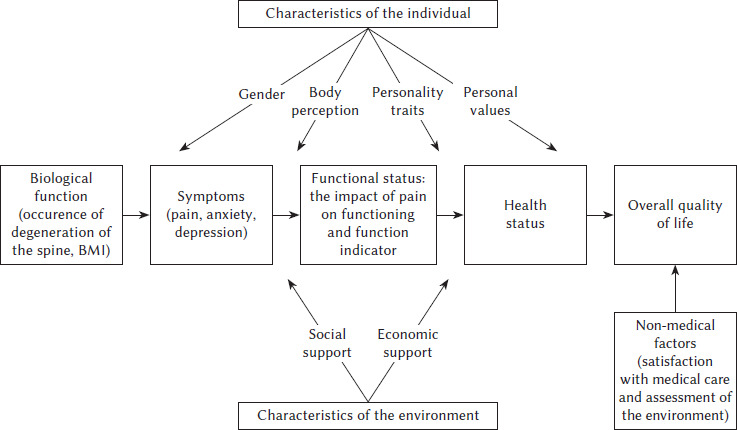
The present study aimed to comprehensively test the relationships between the variables in Wilson and Cleary’s (1995) quality of life (QoL) model in a group of people with chronic low back pain (CLBP) and to compare the obtained results with the relationships found in people who do not experience chronic back pain in the lumbosacral region. To achieve the research goal, models (in the groups of people experiencing and not experiencing chronic back pain) in which the predicted variable is the overall quality of life were evaluated. The tested model in presented in Figure 1.
PARTICIPANTS AND PROCEDURE
PARTICIPANTS
Data were obtained from 177 people suffering from CLBP, and 160 participants reported having no such pain. The participants from both groups were similar in each of the sociodemographic factors investigated: age, gender, education level, place of residence, being in a relationship. The characteristics of the study participants are presented in Table 1.
Table 1
Characteristics of study participants
The inclusion criteria were as follows: 1) age 25-65 years; 2) chronic lower back pain; 3) duration of pain for at least 3 months most of the time or recurrent episodes of pain in the past 12 months; 4) undergoing procedures because of pain, such as rehabilitation or manual techniques or the use of painkillers. The exclusion criteria were as follows: 1) presence of current radiculopathy (damage to spinal roots); 2) disc herniation surgery within two years before participation in the study; 3) other types of spinal surgery in the two years before participation in the study; 4) confirmed pathology of the hip joint; 5) the presence of pathology within the spine, confirmed by a CT scan or magnetic resonance imaging, such as stenosis (stenosis) of the spinal canal, spondylolisthesis, tumor, or fracture.
PROCEDURE
Those subjects suffering from chronic back pain completed a set of online questionnaires: a demographic data questionnaire, Pain Questionnaire–short version, Depression and Anxiety Short Self-Rating Scale, Body Evaluation Scale, TIPI-PL, Shalom Schwartz’s Portrait Values Questionnaire, EQ-5D-5L, Life Satisfaction Scale, Berlin Social Support Scales, and additional questions on support, economic, environmental assessment, and satisfaction with medical care. In contrast, those without chronic pain completed the shorter version, which included a demographic survey, the Depression and Anxiety Short Self-Rating Scale, TIPI-PL, Shalom Schwartz’s Portrait Values Questionnaire, EQ-5D-5L, Life Satisfaction Scale, Berlin Social Support Scales, and questions on economic support and environmental assessment. Participation in the study was voluntary and anonymous. Volunteers participated in the study. The research procedure was developed in a way that took into account the psychophysical condition of the subjects and was designed in such a way that the study was as little burdensome as possible for the participants, particularly for people with chronic pain. The time to answer questions was about 25 minutes. The form of conducting the online survey was caused by the epidemic situation (COVID-19 pandemic) and the importance of difficult personal access to potential study participants.
The study was conducted in accordance with the Declaration of Helsinki and approved by the research ethics committee of the Faculty of Psychology of the University of Warsaw (opinion issued on March 22, 2016).
RESEARCH TOOLS
Biological factors, the occurrence of spinal disc herniation (degenerative changes confirmed by X-ray of the spine or by magnetic resonance imaging of the spine), and the body mass index (BMI) based on information on gender, weight, and height were self-reported by the participants.
The Polish version of the Ten Item Personality Inventory (TIPI-PL; Sorokowska et al., 2014) was used to measure personality traits. The questionnaire is used to measure five dimensions of personality described in the Big Five concept (Costa & McCrae, 1992): emotional stability, extraversion, openness to experience, conscientiousness, and agreeableness. The scale consists of 10 items, two for each personality trait. The examined person assesses how well each of the characteristics describes them as a person, here using a scale from 1 (strongly disagree) to 7 (strongly agree). One question diagnosing each personality trait is positively formulated, and the other is negatively formulated. The score for the scale is obtained by reversing the negative question and calculating the arithmetic mean for both items measuring a given feature. The higher the score, the more severe is the trait. The reliability of the scale was assessed by calculating Cronbach’s α coefficient (Sorokowska et al., 2014): emotional stability α = .65-.83, extraversion α = .68-.74, openness to experience α = .44-.47, conscientiousness α = .75-.80, α = .65, and agreeableness α = .54-.58.
The Shalom Schwartz Portrait Values Questionnaire (PVQ-RR version; Cieciuch & Zaleski, 2011; Schwartz et al., 2012) was used to measure personal values. It consists of 57 items measuring 19 values (three items for each value). The items contain a description of what is important in people’s lives; the content of the items relates to human goals, aspirations, and beliefs. After having read the description the participant answers the question, “To what extent is this person similar to you?” using a scale from 1 (completely unlike me) to 6 (very similar to me). The measured values can be arranged into four groups: openness to change (self-direction in action, self-direction in thinking, stimulation, hedonism); self-empowerment (achievements, power over resources, power over people, prestige); conservativeness (personal security, social security, adaptation to rules, adaptation to people, tradition, humility); and transcending oneself (kindness-caring, kindness-reliability, universalism-tolerance, ecological universalism, social universalism). They can also be aggregated to up to 10 values. Cronbach’s α reliability coefficients are calculated for each of the 19 scales ranging from .53 to .83 (Cieciuch, 2013).
The Body Assessment Scale (Franzoi & Shields, 1984; Lipowska & Lipowski, 2013) was used to examine attitudes toward one’s own body. Three characteristics (items) related to the functional aspect of the body or its appearance were used in the analysis: physical capacity, energy level, and physical conditions. These dimensions were selected in relation to the three areas of body perception used in Markey et al.’s (2020) study. This study focused on pain perception, body dissatisfaction, and positive body image.
The Short Self-Rating Scale for Depression and Anxiety (Kokoszka, 2008) was used to assess the intensity of the symptoms of depression and anxiety. It consists of 10 questions, five each for depression and anxiety. The questions were selected based on the most significant psychopathological symptoms of depressive disorders from the ICD-10 and DSM-IV classifications. Because of the lack of one main type of anxiety disorder, states of commonly experienced anxiety, fear, and somatic symptoms of anxiety characteristic of generalized anxiety disorders, tendencies to worry, and phobic tendencies to avoid were included. The examined person responds on an 11-point Likert scale, where 0 is the norm or no symptom and 10 the extreme intensity of the symptom or a complete deviation from the norm. The reliability of the scales is high: α = .95 for depression and α = .94 for anxiety.
The functional status is represented by two indicators: the impact of pain on functioning and the function indicator. The first was captured using the Pain Questionnaire–short version (Cleeland & Ryan, 1991); according to the results of the study of the structure of the Polish language version of the BPI-SF questionnaire, which was conducted on a sample of cancer patients, the factor analysis distinguished two factors (two subscales): functioning through pain (question 9, items A-G) and pain intensity (questions 3-6) (Leppert & Majkowicz, 2010). The subject states the extent to which pain interfered with their functioning in the past 24 hours in the following areas: general activity, mood, ability to walk, usual work, contact with other people, sleep, and enjoyment of life. The examined person gives answers using an 11-point scale, where 0 means that the pain did not interfere with a given aspect of functioning at all and 10 that it completely interfered. The higher the value of the index, the greater is the functional disruption caused by pain. Reliability expressed by Cronbach’s α coefficient for individual scales before the start of analgesic therapy and 7, 8, and 14 days later is in the range of .86 to .99.
The second indicator was the EQ-5D-5L questionnaire (van Reenen & Janssen, 2015). The subject assesses functioning in five areas: the ability to move (mobility), the ability to take care of oneself, the ability to perform daily activities, the feeling of pain or discomfort, and the feeling of anxiety or depression, which were measured using a single numerical value (the EQ Index); this was calculated using the valueEQ5D package (Krishnan, 2020), which was developed based on the results obtained from Polish respondents (Golicki et al., 2010). The values range from –0.52 to 1, where a higher value indicates a better way of functioning (Golicki et al., 2010).
Health status. The question about the general perception of health comes from the EQ-5D-5L questionnaire (van Reenen & Janssen, 2015). The subject marks the answer using a visual analog scale, where 100 is the best imaginable health and 0 the worst imaginable health. A higher score means a better assessment of one’s health.
The Life Satisfaction Scale (Diener et al., 1985), here in the Polish adaptation of Jankowski (2015), was used to measure the overall assessment of life. It consists of five statements in which the respondent assesses the extent to which they apply to their life. The measure uses a 7-point scale from 1 (strongly agree) to 7 (strongly agree). A higher score means a greater sense of life satisfaction (Juczyński, 2001). The psychometric properties of the tool are satisfactory (Juczyński, 2001).
Social support. One of the subscales of the Berlin Social Support Scales (Schulz & Schwarzer, 2003) in the Polish adaptation of Łuszczyńska et al. (2006) was used to measure the social support currently received. It contains a description of 15 behaviors that a relative has shown toward the tested person in the last week. The items included in the scale refer to emotional, instrumental, and informational support (e.g., “This person complained about me” and “This person cared about many of my affairs”). The examined person indicates who a close person is, from among spouse, partner, child, or friend; they can also name another person and then assess their behavior on a scale from 1 (completely untrue) to 4 (completely true). Reliability assessed using Cronbach’s α coefficient is satisfactory, being .85 for the scale for currently received support (Łuszczyńska et al., 2006).
Economic support was asked about using a question from the Social Diagnosis of 2015 (Czapiński & Panek, 2015). The surveyed person was asked to indicate whether their household receives help from outside and, if so, in what form – financial, material, services, or help over an adult. The analysis included two levels of the variable: not receiving or receiving (regardless of the form) external help.
As nonmedical factors, the respondents’ satisfaction with health care was assessed on a scale from 1 (very dissatisfied) to 6 (very satisfied), and the assessment of the environment in which a person lives was taken into account. It was asked about using a question from the Social Diagnosis of 2015 (Czapiński & Panek, 2015). The respondent was asked to indicate the degree of satisfaction on a scale from 1 (very dissatisfied) to 6 (very satisfied) with the following aspects of the environment: housing conditions, the town where a person lives, security in the place of residence, recreational areas in the place of residence, and local public transport.
DATA ANALYSIS
The a priori sample size for the regression model was calculated using G*Power (Faul et al., 2007, 2009) based on the following assumptions: anticipated effect size = 0.2, statistical power level = 0.95, number of predictors = 22 for the CLBP group and 17 for the no pain group, probability level = 0.05.
To determine which indicators are predictors of quality of life, two multiple regression models were calculated for the dependent variable overall quality of life (life satisfaction) in groups of people experiencing and not experiencing chronic back pain. Before constructing the final sets of variables for the models, it was checked how strongly the variables correlated with each other and with the dependent variable. Pearson’s r correlation coefficient and p values are presented in Table 2 (people with chronic back pain) and Table 3 (people without chronic back pain). The collinearity factor VIF (variance inflation factor) was also calculated. Its values for all independent variables for the four models ranged from 1.08 to 2.76, which indicates no excessive collinearity. Only those variables for which the coefficients of linear correlation with the dependent variable were found to be statistically significant were included in the final model (Tabachnick et al., 2007).
Table 2
Correlation coefficients between analyzed variables in the group of people suffering from chronic low back pain (n = 177)
[i] Note. 1 – BMI; 2 – degeneration of the spine (discopathy); 3 – pain severity; 4 – depression severity; 5 – anxiety severity; 6 – impact of pain on functioning; 7 – functional index; 8 – health status; 9 – overall quality of life; 10 – extraversion; 11 – emotional stability; 12 – physical condition; 13 – energy level; 14 – figure/physique; 15 – self-transcendence; 16 – openness to change; 17 – self-enhancement; 18 – conser-vation; 19 – received social support; 20 – received economic support; 21 – satisfaction with environment; 22 – satisfaction with healthcare.
Table 3
Correlation coefficients between analyzed variables in the group of people not experiencing chronic low back pain (N = 160)
[i] Note. 1 – depression severity; 2 – anxiety severity; 3 – functional index; 4 – health status; 5 – overall quality of life; 6 – extraversion; 7 – emotional stability; 8 – physical condition; 9 – energy level; 10 – figure/ physique; 11 – self-transcendence; 12 – openness to change; 13 – self-enhancement; 14 – conservation; 15 – received social support; 16 – received economic support; 17 – satisfaction with environment.
Results
The descriptive statistics, that is, the mean, standard deviation, and the range of results for two groups – people experiencing and not experiencing chronic back pain – are presented in Table 4.
Table 4
Descriptive statistics for variables in the model
People suffering from chronic back pain, compared with people not feeling this pain, had more severe symptoms of depression and anxiety, a lower functioning index, a poorer assessment of their health, and were less satisfied with life. The personality trait emotional stability was less intense in them; they assessed their physical capacity, energy level, and physical conditions as worse. They placed the value of conservatism lower, received less social support in their own opinion, and assessed the environment in which they lived more negatively.
The linear regression model for the dependent variable overall quality of life (life satisfaction) in the CLBP is well suited to the data in both the CLBP F(14, 162) = 12.83, p < .001 and nonpain group F(12, 147) = 6.91, p < .001. Statistically significant predictors in the CLBP model are the severity of anxiety, emotional stability, receiving social support, and receiving external help. Together, these predictors explained 48.4% of the variance in the variance of the dependent variable. Statistically significant predictors in the model in the nonpain group were general health assessment and emotional stability. Together, these predictors explained 30.9% of the variance in the value of the dependent variable.
The regression coefficients are presented in Table 5.
Table 5
Regression coefficients. Model for the dependent variable overall quality of life in the group of people suffering from chronic low back pain
Discussion
The results of the study enabled a partial analysis of the relationships between the variables included in Wilson and Cleary’s theoretical model in the group of people suffering from chronic low back pain, thus contributing to a better understanding of the functioning of people with this condition.
The results regarding the role of depression and anxiety symptoms are partly consistent with those of other studies obtained in this group of respondents, hence showing the relationship between the symptoms of depression and anxiety and quality of life (Frühwald et al., 2001) and the symptoms of depression and anxiety (Ketiš, 2011) and how this is a predictor of quality of life in a group of people with chronic pain. A probable explanation in the group of people with chronic pain was the presence of an average correlation between anxiety and depression (r = .56).
The role of depressive and anxiety symptoms may mediate the relationship between pain (e.g., intensity, duration) and quality of life or act as a moderator of this relationship. Previous studies have shown that anxiety can mediate the relationship between headache frequency and quality of life in chronic tension headache sufferers, while depression can mediate the relationship between headache duration and the psychological domain of quality of life (Peñacoba-Puente et al., 2008).
The severity of pain correlated with the severity of depression, anxiety, pain impact on function index, functioning index, overall health perception, and overall quality of life (life satisfaction) in patients with chronic low back pain. These results are consistent with those of previous studies (Ketiš, 2011; Yamada et al., 2014). However, the lack of statistical significance of the pain predictor in both regression models contradicts other research findings (Guclu et al., 2012; Schaller et al., 2015). However, the reason for this difference may be that, in the present study, the average pain intensity was much lower than in the study by Guclu et al. (2012) – M = 62.21, SD = 22.11 on the VAS 0-100 scale.
The assessment of health status did not turn out to be a significant predictor of overall quality of life in the case of people with chronic pain, but a different result was obtained in the case of people not experiencing pain. However, for the latter, the impact of the assessment of health status on life satisfaction was small. There are studies on patients with various chronic diseases which indicate that this relationship need not be present, such as in the study by Baker et al. (2006) in patients with xerostomia (dryness of the oral mucosa because of damage or removal of the salivary glands).
None of the models revealed a significant role of personal values in explaining the variability of the overall quality of life. Both in the group of people with chronic back pain and those not experiencing pain, a weak positive relationship was observed between conservatism, which includes, among others, values such as adaptation, tradition, and safety, and overall quality of life, which is understood as satisfaction with life. This result is contrary to the assumed situation (Bilsky & Schwartz, 1994; Sagiv & Schwartz, 2000) and empirical findings in palliative care patients (Fegg et al., 2005). An explanation for the discrepancies between the previous research results and current results can be found in the selection of the research sample. The results presented above come from students (Kasser & Ahuvia, 2002; Sagiv & Schwartz, 2000) and from dying people (Fegg et al., 2005). An alternative explanation for this result is the function of the values that contribute to conservatism. The values motivate people to subordinate themselves to socially imposed expectations (security), but they are also based on actions aimed at reducing anxiety (adaptation, security) (Schwartz & Sortheix, 2018). The role of values may also indirectly affect the assessment of quality of life, which has not been taken into account in the models.
The role of emotional stability was revealed in the assessment of the overall quality of life, both in the group experiencing and the group not experiencing chronic back pain. However, extraversion turned out to be an insignificant factor in none of the presented models. These results are only partially consistent with the results of previous studies (Cvijetic et al., 2014; Huang et al., 2017).
Currently received social support is associated with a higher assessment of the overall quality of life and receiving external help, which leads to a reduction in the group of people suffering from chronic low back pain. Thus, these factors are not related to the physical aspect of quality of life, which is consistent with the results of a systematic review by Campbell et al. (2011), which indicated the existence of a relationship between social support and indicators of well-being. Another study involving women experiencing chronic pain found that neuroticism, extraversion, and social support explain as much as 74% of the variance in well-being (Faraji et al., 2019). The role of social support in the context of quality of life has also been demonstrated for many other groups of patients (e.g. Kong et al., 2002; Megari, 2013).
In our study, none of the three aspects of body image – physical capacity, energy level, and physical condition – were significant predictors of overall quality of life or health. This may be because only single questions were used, not the scores of the whole scale. The use of single items is less conventional and preferable when used to compare men and women (Franzoi & Koehler, 1998).
The relationships between quality of life, social support, personality, and chronic pain are probably more complex than depicted in the model. Soriano et al. (2012) identified a group of patients with chronic pain, which can be defined as vulnerable, in which poorer adaptation to the disease, lower quality of life, and the use of maladaptive coping strategies were identified. This group was distinguished by a high intensity of neuroticism, low extroversion and conscientiousness, and moderate agreeableness. Helgeson (2003) also suggested that the perception of social support is also related to personality. This partly supports the research result indicating that a high score on the social support network scale eliminates the negative effect of neuroticism on psychological well-being (McHugh & Lawlor, 2012). Therefore, the relationships between these factors should be subjected to in-depth analysis in a group of patients with chronic pain in future studies.
Although the participants in the present study were not asked about their financial situation, the vast majority of people who answered yes to the question about receiving such assistance indicated that it was financial assistance. This may indicate that they were not entirely in a satisfactory financial situation. There is evidence that financial satisfaction is one of the factors explaining overall life satisfaction (Medgyesi & Zólyomi, 2016) and that higher family income is associated with a more positive assessment of the quality of life (Horng et al., 2005).
Satisfaction with health care did not turn out to be a significant predictor in the present study. A possible explanation may be the specific nature of the disease and need to constantly undergo various activities aimed at reducing pain (e.g. Dourouka et al., 2023) and maintaining the best possible performance. In the present study, the vast majority of people (75%) used exercise, nonsteroidal anti-inflammatory drugs, or massage to relieve symptoms and improve and maintain fitness, which usually does not require constant contact with the health care system. A minority of the study participants reported using physiotherapy, drugs from higher levels of the analgesic ladder, or the use of other specialized methods as the main activities, which involve the need to contact healthcare facilities and employees.
The inclusion of variables relating to factors from all levels described in Wilson and Cleary’s (1995) theoretical model can be regarded as a strength of the study. The study’s inclusion criteria were given, but in some aspects they may be more specific (eligibility of study subjects, the time intervals over which study participants underwent rehabilitation, the proportion of pharmacotherapy used. Thus, the study has enabled an initial exploratory analysis of the model in a group of people with chronic low back pain. Another advantage of the study is a better balance of male and female participants. It should also be mentioned that the surveyed variables included the characteristics of a person, both personality traits and personal values. The results of previous studies indicate the role that they may play in patients with chronic back pain, but the inclusion of these features has not been a standard procedure in the selection of variables in the tested models so far.
The limitations of the present study include the method of reaching the respondents via the internet. The current study was carried out during the COVID-19 pandemic; therefore, because of the epidemic threat, it was impossible to meet the study participants in person, which had a negative impact on the number of participants (it was more difficult to obtain complete answers in a fairly long study), but also contributed to mostly younger people participating, most of whom had some form of higher education. Thus, it can be assumed that the results might have been different if older people had been better represented, but also if the participants had experienced more severe pain and greater disability.
The statistical method may also be a reason to limit conclusions about the variables included in the model. In the future, it is worth considering the use of structural equation modeling, which would allow us to check not only direct, but also indirect, relationships between variables (Holland, 1988). Using this method also overcomes some of the limitations of regression, such as the ability to use a variable as both dependent and independent at the same time. However, this method requires much larger sample sizes. Bentler and Chou (1987) have indeed proposed the criterion of five subjects per variable in the model, but only when the distribution of variables does not differ from the normal distribution and there are no outliers. On the other hand, a safer solution would be 15 people per variable (Stevens, 2012), which, with the number of predictors assumed in the study, would result in a sample size almost twice as large. The modeling of structural equations on insufficiently large samples can lead, for example, to the failure to identify a model that fits the data satisfactorily. Despite the obvious advantages of modeling structural equations, it should be noted that the method of data analysis used in our study was used by other researchers to study the relationships between variables in the Wilson and Cleary model, for example, in people with AIDS (Cosby et al., 2000).
In the future, it is also worth considering conducting a longitudinal study with the participation of people struggling with chronic low back pain. This method of collecting data may make it possible to examine bidirectional relationships and interrelationships between the variables in the model. Wilson and Cleary’s (1995) theoretical model assumes such a cause-and-effect relationship between variables, but it is not possible to verify these assumptions in a cross-sectional study.