BACKGROUND
Cancer is still a major health problem and is the second cause of mortality worldwide, behind cardiovascular disease. It is estimated that cancer caused 9.9 million deaths in 2020, with lung (18.4%) and colorectal (9.2%) cancers the most common causes (Ferlay et al., 2021). In Spain, a similar trend was observed, with a total of 113,000 deaths during this period, mostly in patients with lung and colorectal cancer (Sociedad Española de Oncología Médica, 2021). Caregivers and patients are at a high risk of developing psychological distress and a reduced quality of life in the first year after diagnosis, but few studies have focused on the study of these variables using a dyad perspective involving both caregivers and patients. The literature has firmly established that a diagnosis of cancer affects caregiver and patient psychological wellbeing in terms of anxiety and depression and quality of life. Previous data for caregivers showed higher levels of depression (42%) and anxiety (46%) and a reduced quality of life (Geng et al., 2018), and there is evidence of the negative influence of anxiety and depression on the quality of life of cancer caregivers (Peh et al., 2020; Qiuping et al., 2018). In patients, depression is reported by up to 20% and anxiety by up to 10% of patients and negatively impact quality of life and survival, which follows a similar pattern as the one observed in caregivers (Erim et al., 2020; Park et al., 2020; Taarnhøj et al., 2020). Despite the relevance of these results, the data are often taken from cross-sectional studies, which focus on an individual level and specific types of cancer. While most studies have assessed caregivers and patients independently, interest in the study of the caregiver–patient interaction as a dyad has increased recently following the recommendations of the US National Cancer Institute and the US National Institute of Nursing Research. This is because the impact of cancer affects the couple as a whole unit within an “emotional system” (Kent et al., 2016), since the illness may change the relational dynamics between the members of the dyad, showing a mutual impact on each other in terms of quality of life, psychological health and adjustment (Li & Loke, 2014; Streck et al., 2020). One means of studying the mutual interaction between cancer patients and their caregivers as a dyad is the actor-partner interdependence model (APIM). This model can be used to explore the effects of a predictor assessed in both members of the dyad on one’s own outcome (actor effect) and over the partner’s outcome (partner effect) using structural equation modelling (SEM) (Kenny et al., 2020), and has been used in previous research involving cancer patient and caregiver dyads (Dorros et al., 2010; Kershaw et al., 2015). Following this line, previous research has shown the relationships between and predictive utility of anxiety and depression with respect to quality of life in both caregivers and patients within a dyad. Data from cross-sectional studies with advanced and colorectal cancer patients and their caregivers showed that anxiety and depression had both actor and partner effects on the couples’ quality of life (Geng et al., 2018; Lee et al., 2017; Lin et al., 2021). In a similar study, Huang and McMillan (2019) reported that higher depression scores were associated with lower levels of quality of life in caregivers and in advanced cancer patients, but depression showed a positive effect on the functional wellbeing of the relative with cancer (partner effect). Therefore, the influence of psychological distress, especially depression, on quality of life in cancer-caregiver dyads remains unclear, particularly in the first few months after cancer diagnosis when early screening of psychological distress is recommended to prevent any decline in the quality of life (Sadoughi & Salehi, 2017). Despite the relevance of these previous studies, the data were derived from cross-sectional studies, so there is a lack of longitudinal prospective studies with a dyadic design that assess the possible influence of anxiety and depression on quality of life in the first 6 months after diagnosis. Accordingly, the present study had the following objectives: first, to identify and assess any differences in anxiety, depression and the different quality of life domains in both caregivers and patients shortly after cancer diagnosis (T1) and 6 months later (T2), and, secondly, to analyse the dyadic relationships between anxiety and depression at T1 on the different quality of life domains in T2 using a structural equation model.
PARTICIPANTS AND PROCEDURE
PARTICIPANTS
The study consisted of 67 dyads (caregiver and patient). The following inclusion criteria were applied to caregivers: men and women; at least 21 years old; currently in a close relationship with the patient; not a professional caregiver; mentally capable of answering the questionnaires; and with no history of mental disability or dementia. The inclusion criteria for patients were: cancer diagnosis (all types) in the last 30-45 days; eligible for treatment; and at least 21 years old. Before data collection, caregivers and patients signed informed consent about the confidentiality of the data obtained and were informed they could leave the study at any time without any negative consequences.
INSTRUMENTS
Sociodemographic and clinical information, including sex, age, education, employment status and relationship with the patient, was collected for caregivers and patients. Patients also provided information about their cancer and treatment.
Hospital Anxiety and Depression Scale. We used the Hospital Anxiety and Depression Scale (HADS; Zigmond & Snaith, 1983), which is a widely used instrument to assess anxiety and depression in clinical settings, including for cancer patients and their caregivers (Lee et al., 2017; Mitchell et al., 2010). The instrument consists of 7 items for each scale (anxiety and depression) and each item is scored from 0 to 3, giving a maximum score of 21 on each scale. A score of eight or higher is considered a good cut-off point to establish the presence of depression and anxiety. This instrument has been shown to offer good internal consistency in a Spanish population for both anxiety and depression (α = .86) (Quintana et al., 2003).
Health Survey. The Short Form Health Survey (SF-36) is a questionnaire designed to assess the quality of life in the following eight domains through 36 items: physical functioning, role limitations due to physical problems, bodily pain, general health, vitality, social functioning, role limitations due to emotional problems and mental health. The scores for each scale are transformed into T scores (M = 50, SD = 10), ranging from 0 (the lowest quality of life) to 100 (the highest quality of life). The SF-36 is widely used to assess quality of life in cancer caregivers and patients (Chow et al., 2020; Vespa et al., 2018) and it has been validated in a Spanish population, showing good internal consistency (Vilagut et al., 2005).
PROCEDURE
This was a longitudinal prospective study with two assessment points: T1 (45-60 days after diagnosis) and T2 (180-200 days after diagnosis). The data were collected at Reina Sofía University Hospital in Córdoba (Spain) in the day care unit for ambulatory cancer patients. Potential participants (caregivers and patients) were consecutively recruited by training nursing staff according to the inclusion/exclusion criteria. When the participants (both patients and caregivers) agreed to take part in the study, a member of the research team gave them a set of questionnaires to complete at the designated time points (T1 and T2). The data were collected to coincide with the follow-up appointments during the first 6 months of the patient’s cancer treatment and were supervised by the nursing staff. A total of 176 dyads were approached to participate, and 141 completed the first assessment at T1. The reasons for not completing the assessment were: end of treatment (n = 12), death (n = 8), leaving treatment (n = 7), transfer to palliative care (n = 6) and transfer to other centres (n = 4). The second assessment at T2 was completed by 67 dyads. The reasons for not completing the second assessment were: end of treatment (n = 41), transfer to other centres (n = 12), transfer to palliative care (n = 8), not attending the appointment (n = 8) and death (n = 3). The final sample, composed of 67 dyads, was a similar size to previous studies on cancer dyads (Baumstarck et al., 2018; Sterba et al., 2017) and the response rate (47%) was also similar to previous research (Lambert et al., 2013). The study was approved by the ethical committee of the Andalusian Biomedical Research Ethics Portal (ref. no. 3262).
STATISTICAL ANALYSIS
IBM SPSS v.22 was used to obtain the descriptive data and to analyse the relationships and differences between variables. The paired samples t-test was used to analyse the differences between T1 and T2 in HADS and SF-36 variables. To identify the relationships between the sociodemographic data (age, sex, education, employment status) and the anxiety, depression and quality of life domains at the two assessment points, we determined Pearson’s correlation coefficient, point-biserial correlation and Spear-man’s rho coefficient after selecting the appropriate test depending on the variables being analysed. The actor-partner interdependence model (APIM) is commonly used to analyse dyadic data, examining the effect of one predictor’s score on one’s own outcome (actor effect) and on the partner’s score (partner effect) (Kenny et al., 2020). We used a free online application to analyse the APIM, which can be accessed at http://lavaan.org/APIM_SEM/. The software can be used to analyse data from indistinguishable or distinguishable dyads using Lavaan from the R-package for SEM (Stas et al., 2018). In the present study, we applied the APIM model for distinguishable dyads to test the actor and partner effects in both caregivers and patients using the anxiety and depression scores at T1 as predictors and the scores for the SF-36 quality of life domains at T2 as dependent variables. Age, sex, relationship with patient, cancer type and cancer treatment were used as covariables in all the models after adapting for binary variables (0 – no, 1 – yes) (Rosseel, 2012).
RESULTS
Participant characteristics are shown in Table 1. The final sample was composed of 67 dyads (patients and caregivers). Over half of the sample was female (56.7% of patients and 65.7% of caregivers), and the patients were older than the caregivers (mean patient age – 58.60 years; mean caregiver age – 51.63 years). Patients and caregivers had similar educational levels (basic education in 35.8% of patients and 41.8% of caregivers) and in terms of employment status, a significant percentage of patients (28.1%) were retired, whereas caregivers had a full time job (32.8%). Most of the caregivers were the partner of the patient (58.2%), and the most prevalent type of cancer was gastrointestinal cancer (49.2%), with surgery + chemotherapy (42.4%) being the most frequent treatment.
Table 1
Sample characteristics (caregivers N = 67, patients N = 67)
Caregiver and patient anxiety and depression levels showed that anxiety reached significant values (score > 8) among caregivers at both assessment points; caregiver anxiety at T1 was M = 8.24, SD = 4.06 and at T2 M = 8.45, SD = 3.23, with no significant difference between the two assessment points (t(66) = –.53, p = .592). Similar results were obtained for patients, whose anxiety score at T1 was M = 8.45 (SD = 3.72) and at T2 M = 8.73 (SD = 3.56), although the difference was not statistically significant (t(66) = –.92, p = .358). With respect to depression, caregiver scores at T1 and T2 were less than 8 (T1, M = 6.40, SD = 3.91 and T2, M = 7.00, SD = 3.28) and in patients the data were slightly higher but not clinically relevant (T1, M = 7.46, SD = 4.16 and T2, M = 7.96, SD = 4.09), with no statistical differences for either caregivers or patients in depression scores (t(66) = –1.43, p = .145 and t(66) = –1.25, p = .214, respectively) when comparing T1 and T2. In the bivariate analysis, neither patients nor caregivers presented any relationship between their sociodemo-graphic variables (age, sex, education, employment status) and their anxiety and depression scores at either of the assessment points. Table 2 shows the results from the quality of life questionnaires. In care-givers, there were significant differences between T1 and T2 in physical functioning (t(66) = –11.18, p < .001), bodily pain (t(66) = –2.52, p = .014), social functioning (t(66) = 3.81, p < .001) and mental health (t(66) = 8.00, p < .001). Among patients, there were differences in the general health (t(66) = 2.01, p = .049) and vitality domains (t(66) = 2.01, p = .049).
Table 2
SF-36 domain scores at T1 and T2 and t test results for caregivers and patients
Regarding the sociodemographic variables of caregivers, only age correlated with physical functioning (r(65) = –.45, p < .001) while in patients age correlated with general health at T1 (r(65) = –.25, p = .031). Six months later (T2), caregiver age correlated with physical functioning (r(65) = –.40, p < .001) and general health (r(65) = –.30, p = .013). In patients, age correlated with physical functioning (r(65) = –.26, p = .021) and bodily pain (r(65) = –.35, p = .003).
In terms of the dyadic analysis, the structural equation model shown in Figure 1 was used to estimate the APIM. The results for the impact of anxiety and depression (T1) on the different domains of quality of life at T2 are shown in Table 3. For the covariates in anxiety models, age acts as a covariate in the effect of anxiety on vitality (model 5) of caregivers (95% CI [–.48, –.07], p = .008). Similar results were observed in model 7 (social functioning), where age also appears to be significant (95% CI [–.85, –.14], p = .006) for caregivers. In terms of mental health (model 8), caregivers for patients with gastrointestinal cancer obtained significantly lower scores (–9.41 points, p = .021). In depression models, breast cancer acts as a significant covariate, obtaining –21.60 points (p = .021) in the effect of depression on social functioning in patients (model 7), while in caregivers, age was a significant covariate in the relationship between depression and social functioning (95% CI [–.85, –.18], p = .003). The rest of the covariates were not significant.
Figure 1
Parameters of the structural equation modeling to estimate the APIM. X = T1 (45-60 days after diagnosis), and Y = T2 (180-200 days after diagnosis).
Note. a - patient, b - caregiver, e - error probability.
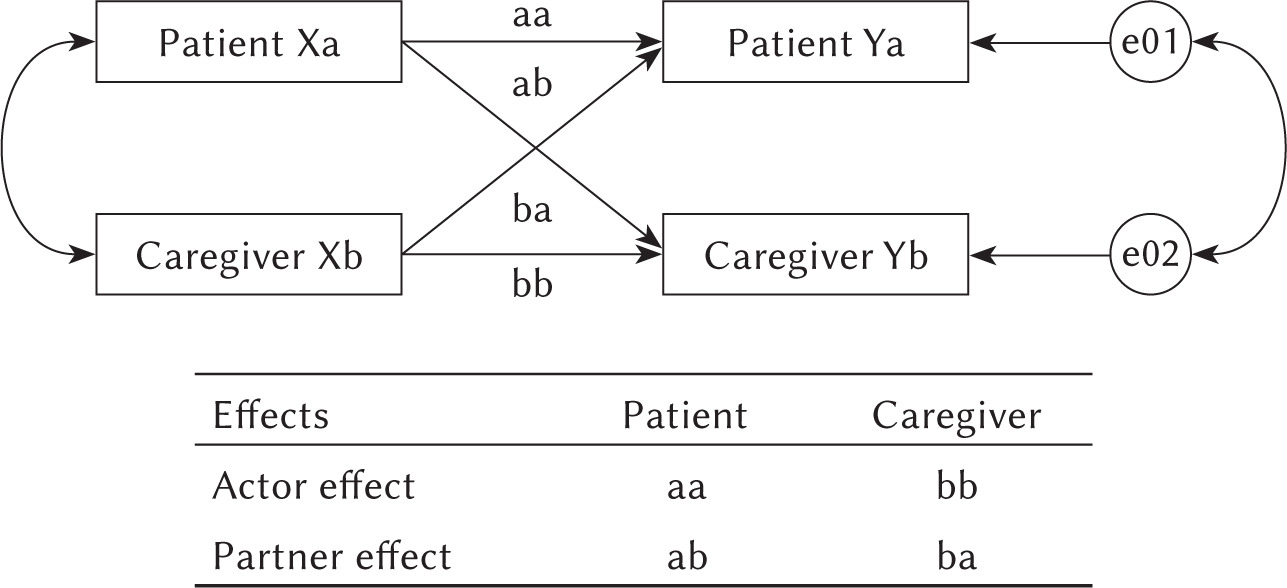
Table 3
Standardized path coefficients of the eight models
DISCUSSION
The relationships between anxiety and depression and quality of life in cancer patients and caregivers have been well established in the literature (Geng et al., 2018; Lee et al., 2017; Peh et al., 2020). There is scant information, however, about the evaluation of the differences in the quality of life domains and the dyadic relationships between anxiety and depression and these domains using longitudinal prospective studies applied to the first 6 months after the diagnosis of cancer. In terms of psychological distress, the results showed clinically relevant anxiety scores in caregivers and patients, while the depression scores were within normal ranges, and there were no significant differences between the scores obtained shortly after diagnosis and 6 months later. These results are in line with previous research and suggest that anxiety is the most prevalent issue for patients and caregivers, probably because of uncertainty about the future in the first few months after diagnosis (Lin et al., 2020). In caregivers, the quality of life scores for physical functioning and bodily pain improved significantly over time, while social functioning and mental health were significantly worse 6 months after the first evaluation. There was also a relationship between age and some quality of life domains at the two assessment points. These results are similar to previous findings and emphasise the negative influence of the new tasks that caregivers have to take on in the first few months after the diagnosis. These new duties may affect their physical condition and reduce their time available for social activities, which in turn affects psychological well-being, particularly in older caregivers (El-Jawahri et al., 2015; Lee et al., 2017; Sterba et al., 2017). For patients, quality of life scores were lower than those for caregivers in almost all domains and were relatively stable over time, highlighting the negative impact of cancer on patient quality of life (Terro & Crean, 2017; Drageset et al., 2016). Following this line, comparison of the two assessment points revealed significant reductions in general health and vitality. These are probably associated with the consequences of cancer treatment over this period and the age of the sample, as previous research has shown that increased age is related to lower quality of life outcomes during this period (Park et al., 2020). Overall, these results for quality of life in caregivers and cancer patients highlight the importance of considering different aspects of quality of life and indicate that age is a relevant variable responsible for worse quality of life outcomes in both patients and caregiverThe dyadic analysis of the influence of anxiety and depression shortly after diagnosis (T1) on the quality of life domains assessed 6 months later (T2) showed that anxiety had a negative actor effect on the physical functioning, general health, vitality, social functioning and mental health domains in patients, while in caregivers the actor effect was present in general health, vitality, emotional role, social functioning and mental health. These results are similar to those observed in previous cross-sectional studies involving cancer patient-caregiver dyads (Dorros et al., 2010; Kershaw et al., 2015; Lee et al., 2017; Lin et al., 2021). However, it is noteworthy that age appears to be a significant covariate in care-givers with respect to the social functioning (anxiety and depression) and vitality domains (anxiety), highlighting the need to pay special attention to these domains in older caregivers and in agreement with our results (Geng et al., 2018). Regarding patients, gastrointestinal (anxiety) and breast cancer (depression) patients obtained significantly lower scores in mental health and social functioning, respectively. These results are probably related to the fact that breast cancer patients are more likely to avoid social interactions in the first year after diagnosis, since the close social network of these patients often sees them as a diagnosis rather than a person during this period (Drageset et al., 2016). On the other hand, previous research found higher levels of distress and a correlation with a lower quality of life in gastrointestinal cancer patients, probably due to the negative effect of stress on the symptoms of gastrointestinal cancer (Edman et al., 2017). Furthermore, we did not observe any partner effects of anxiety on the quality of life domains, but there was a positive partner effect of depression (caregivers) on general health (patients). These results are in line with previous studies which reported positive effects of caregiver depression on the functional wellbeing of the cancer patient, but our study furthers the current knowledge of these relationships. Huang and McMillan (2019) explained these results in terms of gender differences and the self-efficacy of their study sample. In our study, over half of the cancer patients were female (56.7%) and the distribution of caregivers was quite similar (65.7%). In Huang and McMillan’s (2019) study, 74% of caregivers were female, so gender may influence these results as women tend to prioritise the wellbeing of their spouse over their own necessities (Thomeer et al., 2013). However, when analysing gender as a covariate, our results were not statistically significant. In light of these results, more research is needed in order to clearly establish the relationships between anxiety and depression and quality of life using dyadic data. It is necessary to mention some limitations of our study. First, despite the relevance of analysing a sample with different cancer types in terms of its generalisation to clinical settings, this variety may influence the results as different types of cancer produce different emotional and quality of life responses. Although the number of participants in this study was similar to previous research into cancer patients and caregiver dyads, a larger sample is required, particularly to detect partner effects. Furthermore, in the present study, most of the relatives of the cancer patients were partners, but we also included other relationships, such as sons/daughters or friends. This situation is common in cancer settings, but it may influence the results. Future research must consider these limitations in order to extend our knowledge of the dyadic relationships between anxiety and depression and quality of life.
CONCLUSIONS
Anxiety, depression and quality of life may be affected in cancer patients and caregivers in the first few months after the diagnosis of cancer. Using dyadic analysis, the results showed a consistent actor effect in both patients and caregivers, but the partner effect was only observed for depression in caregivers on general health in patients. More research is needed in order to establish a clearer picture of these relationships from a dyadic perspective.