BACKGROUND
COPING
Lazarus’ and Folkman’s (1984) transactional model forms the theoretical basis for the study of stress. According to this model, a stressful experience results from transactions between the individual and the environment. Thus, when someone is faced with a potentially stressful situation, he or she first makes a primary evaluation, i.e., a judgment about the meaning of the situation, to qualify it as stressful, positive, controllable, changeable, or simply irrelevant. In the case of considering it as a stressor, a secondary assessment will determine the available resources and options to cope with the situation. The results of this assessment modify the initial assessment and predispose to the development of coping strategies in two directions: problem-oriented strategies, i.e., behaviors or cognitive acts aimed at managing the source of stress; and emotion-oriented strategies aimed at provoking a change in how the stressful situation is perceived and experienced, regulating negative emotional reactions more effectively (Lazarus & Folkman, 1984).
EMOTION REGULATION
Although the stress and coping model is an important precursor, the study of emotion regulation analyzes the interactions between the environment and the individual in a more detailed way: it considers not only negative and positive emotions but also the expression and experience of emotion (Gross, 1998). Moreover, the temporal units of analysis differ. While the study of coping considers hours, days, or months, emotion regulation tends to consider shorter periods such as seconds or minutes (Gross, 1999). Intending to increase or decrease emotions, regardless of whether they are positive or negative, the process of emotion regulation comprises the following five-step sequence: (1) situation selection, (2) situation modification, (3) attentional deployment, (4) appraisal/cognitive change, and (5) response modulation (Gross, 1998, 2014). In this sense, two strategies to regulate emotions play a fundamental role (Gross, 1998, 1999, 2014) – cognitive reappraisal, and emotional suppression, which is a strategy that represents the last step of the model: response modulation.
Although the process of emotion regulation differs from coping theories, both models operationalize numerous variables identically, as is the case of cognitive reappraisal and emotional suppression (Compas et al., 2017). Furthermore, although the use of emotion regulation and coping strategies depends on the context or situation (Compas et al., 2017; Gratz & Roemer, 2004), it has been shown that some coping and emotion regulation strategies are more related to psychopathological profiles. Therefore, they can be classified as adaptive or maladaptive (Compas et al., 2017; Domínguez-Sánchez et al., 2013). High rates of adaptive strategies are associated with higher levels of life satisfaction and resilient strategies (Aydin Sünbül & Yerin Güneri, 2019; Limonero et al., 2012), secure attachment styles (Garrido-Rojas, 2006; Guzmán et al., 2016), and fewer mental disorders in samples of children, adolescents, and adults (Cludius et al., 2020; Weissman et al., 2019). In contrast, maladaptive strategies have associations, among others, with depression and anxiety (Garnefski & Kraaij, 2006), with fibromyalgia syndrome and pain catastrophizing (Feliu-Soler et al., 2017), and with emotional exhaustion (Dominguez Lara & Medrano, 2016).
SOCIAL REGULATION OF EMOTIONS AND SOCIAL SUPPORT
According to the emotion regulation process, situation selection comprises actions that increase or decrease the likelihood of being in contexts that foster a certain type of emotion, positive or negative (Gross, 1998). When applying this concept to the social basis theory (Beckes & Coan, 2011), it is observed that both complement each other. This theory starts with the assumption that the primary ecology of humans is characterized by its social components. Through the social regulation of emotions, individuals are encouraged to conserve their somatic and neural resources. On the other hand, reduced access to social relationships increases cognitive and physiological effort, leading to a decrease in well-being (Coan & Maresh, 2014).
Although numerous studies have detected a positive association between emotional support and more effective emotion regulation (Criss et al., 2016; Houltberg et al., 2012; Morris et al., 2017; Morris & Age, 2009), the conceptual framework of interpersonal regulation (Zaki & Williams, 2013) should also be taken into account. This framework differentiates, first, between regulatory strategies that modify one’s own or another person’s emotions and, second, whether the emotional regulation process is response-dependent or nonresponse-dependent.
Thus, the emotional support received comprises only increased well-being when it is provided by a close person who responds to the individual’s needs (Maisel & Gable, 2009). That means that the impact on well-being depends considerably on the responsiveness of the emotional support provider (Feeney & Collins, 2015). In contrast, the perception of available emotional support is more conducive to health (Uchino, 2004, 2009).
THE PRESENT STUDY
The present study aimed to use supervised models of machine learning to analyze the associations between certain variables of social support, emotion regulation, coping, and several psychological symptoms. For this purpose, age, educational level, and personality traits were considered as control variables. Although there are studies that have assessed social support variables and, jointly, coping strategies, there are few that have used machine learning models (e.g., Choi et al., 2020; Flesia et al., 2020; Lüscher et al., 2019) and, in addition, these studies did not include personality traits.
Based on the exploratory nature of the study, no hypothesis was determined. In this regard, the following study objectives were established: (1) to determine which variables have the most considerable effect in predicting symptoms. For this purpose, the following independent variables were considered: control variables, social support, adaptive strategies, and maladaptive strategies. (2) To determine which variables have the most significant effect in predicting each of the maladaptive strategies. For this purpose, we considered the following independent variables: control variables, social support, adaptive strategies, and the remaining maladaptive strategies. (3) To determine which variables have the most substantial effect in predicting each of the adaptive strategies and each of the social support variables. For this purpose, the following independent variables were taken into account: control variables, the remaining social support variables, and the remaining adaptive strategies.
PARTICIPANTS AND PROCEDURE
SAMPLE
Non-probabilistic and snowball sampling was performed. The sample consisted of 812 adults (M age = 44.35, SD = 15.32, female = 435) residing in Argentina, composed of 15.0% from the Autonomous City of Buenos Aires, 31.9% from the Province of Buenos Aires, and 53.1% from other provinces of Argentina. A total of 63.8% had incomplete university or higher education. Regarding employment status, 41.5% were working, 23.1% were studying and working simultaneously, 20.8% were unemployed, and 14.5% were retired. Of the participants, 86.2% did not use psychotropic drugs, and 13.8% did. Finally, 23.8% were in psychological treatment, 23.9% were not in psychological treatment and would not like to be, and 52.3% stated they were not in psychological treatment but would like to be. This high percentage could be due to the post-pandemic situation. In addition to that, another study found that 47.0% of the participants had already been in psychological treatment during the mandatory social isolation in Argentina (Gago Galvagno et al., 2021). Due to the online data collection and the large sample size, psychological interviews could not be carried out with the participants. Thus, more detailed information on possible diagnoses of participants who were in treatment and the types of psychotropic drugs they were taking is not available.
MEASURES
Mini International Personality Item Pool. We used the Argentine validation of the Mini International Personality Item Pool (Mini-IPIP) by Simkin et al. (2020). The instrument has 20 items corresponding to five personality traits and employs a five-point Likert scale from 1 (strongly disagree) to 5 (strongly agree). The authors of the aforementioned study obtained internal consistencies of .77 ≤ ω ≤ .88. In the present study, these had the following values: openness to experience (ω = .74), consciousness (ω = .77), extraversion (ω = .75), agreeableness (ω = .83) and neuroticism (ω = .75).
Berlin Social Support Scale. Of the Argentine adaptation of the Berlin Social Support Scale (Schetsche, 2021), we used the following dimensions: perceived comprehension (α = .77), perception of available emotional support (α = .85), and emotional support received (α = .89). In parentheses are the internal consistencies of the present study. This instrument represents each subscale through three items which are answered on a 5-point Likert scale from (strongly disagree) to 4 (strongly agree). In the mentioned study, the internal consistencies of the instrument were found to be in the range .71 ≤ α ≤ .90.
Based on the characteristics of the present study, the following dimensions were not included: perception of available instrumental support and need for support. The first was excluded because the author of the instrument reported a high correlation with the perception of available emotional support; the second because it correlates positively with symptoms (Schetsche, 2021) and the present study aimed to investigate the beneficial effects of social support in reducing symptoms.
Coping Strategies Inventory. The short version of the Coping Strategies Inventory (CSI) by Schetsche et al. (2022) comprises a total of 24 items representing 4 adaptive coping strategies: problem-solving, cognitive restructuring, emotional expression, search for social support, and 4 maladaptive coping strategies: problem avoidance, wishful thinking, self-criticism, and emotional concealment. The instrument offers a 5-point Likert scale from 0 (not at all) to 4 (completely) and, in the aforementioned study, internal consistencies of .74 ≤ α ≤ .83 were obtained.
In the present study, the internal consistencies had the following values: problem-solving (α = .85), cognitive restructuring (α = .67), emotional expression (α = .77), search for social support (α = .80), problem avoidance (α = .66), wishful thinking (α = .78), self-criticism (α = .80), emotional concealment (α = .77).
Cognitive Emotional Regulation Questionnaire. The Argentine version of the Cognitive Emotional Regulation Questionnaire (CERQ) by Medrano et al. (2013) was used. This instrument was constructed to investigate the cognitive processes that people undergo when faced with events that they consider stressful. It has 36 items whose response options range from 1 (almost never) to 5 (almost always). It represents 9 strategies, each composed of 4 items. Of these, 4 dimensions are considered non-adaptive: rumination, catastrophizing, self-blaming, and blaming others; and the following 5 adaptive: putting into perspective, acceptance, positive refocusing, positive reappraisal, and planning (Domínguez-Sánchez et al., 2013; Garnefski et al., 2001; Jermann et al., 2006). In the Argentine validation, the internal consistency indices presented Cronbach’s α within .68 ≤ α ≤ .83.
Due to certain overlaps with the dimensions of the CSI, we did not include positive reappraisal and used only the following factors: positive refocusing (α = .77), blaming others (α = .75), rumination (α = .66), and catastrophizing (α = .78). These represent the factors that exhibited the strongest correlations with anxiety sensitivity and depressive symptoms (Loch et al., 2011). The internal consistencies of the present study appear in parentheses.
Symptom Assessment-45 Questionnaire. The Symptom Assessment-45 Questionnaire (SA-45) by Sandín et al. (2008) has 45 items corresponding to nine dimensions. It uses a five-point Likert scale from 0 (not at all) to 4 (very much or extremely) and, in the aforementioned Spanish-language validation study, internal consistencies had values within .63 ≤ α ≤ .85. In the present study, these took the following values: somatization (α = .82), obsession-compulsion (α = .81), interpersonal sensitivity (α = .81), depression (α = .85), anxiety (α = .83), hostility (α = .83), phobic anxiety (α = .81), paranoid ideation (α = .74), and psychoticism (α = .68).
PROCEDURE
For data collection, the Google Forms digital platform was used and the recruitment of participants was carried out through the social networks Facebook, Instagram, and WhatsApp. To ensure the satisfactory completion of the survey, we conducted a pilot test with 30 individuals.
In the exploratory data analysis, we observed that there were no missing values and determined that it was not necessary to pool several groups of the respective qualitative variables (see sample description), as they all had a balanced distribution that would allow data partitioning for cross-validation. Next, Spearman correlations between continuous variables were computed, as none met the normality assumption (Shapiro-Wilk, α ≤ .01). In line with previous studies (Andrés et al., 2016; Diener et al., 2003), neuroticism exhibited considerable associations with all symptoms (.29 ≤ r ≤ .52, p ≤ .01). Considering neuroticism as a control variable, it was decided not to exclude it from the following analysis. Among social support variables, significant correlations were also observed (.40 ≤ r ≤ .57, p ≤ .01). Under the objectives of the study, these variables were kept in the analyses to determine their respective significance through a feature selection method which is described below.
To decrease the likelihood of committing overfitting, we followed Vabalas et al.’s (2019) suggestions and used the nested (or double) cross-validation method. In this way, the total sample was divided into 10 outer partitions (k-folds) ensuring that all folds had the same distribution concerning the dependent variable.
The training and test data were separated, with 9 partitions being used to develop and train the model, and the remaining fold to test the model. In each of these two subsets (i.e., separately), data preprocessing was performed, which involved (a) analyzing the need to exclude variables with variance close to 0 (none of the variables had to be excluded), (b) centering and scaling numerical variables, and (c) applying dummy encoding to nominal variables. With the training data, we employed the Boruta method (Kursa et al., 2010) for feature selection, as the results of several studies evidenced its superiority compared to other methods (Kumar & Shaikh, 2017; Speiser et al., 2019). With the presence of variables that do not contribute new information, the overall effectiveness of a model may be reduced (Kuhn & Johnson, 2018). Because of this, we included only those variables that, according to the results of the Boruta method, were classified as “confirmed”, with variables classified as “tentative” also being excluded. The development of the predictive models was performed within the inner loop with 10 partitions (v-folds) and 5 repetitions. Thus, 8 learning algorithms were used and each of them was trained, tuned, and evaluated: generalized linear model (GLM) which does not use hyperparameters; Gaussian process with radial basis function kernel (GRBF) which uses the hyperparameter sigma; k-nearest neighbors (kNN) with hyperparameter k (neighbors); neural network (NNET) with the hyperparameters size (of hidden units) and weight decay; random forest (RF) with the hyperparameters mtry (randomly selected predictors), split rule and minimal node size; stochastic gradient boosting (GBM) with the hyperparameters n. trees (boosting iterations), interaction depth (max tree depth), shrinkage, and min. terminal node size; regularized support vector machine (dual) with linear kernel (SVML) with the hyperparameters cost and loss; support vector machines with radial basis function kernel (SVMR) with the hyperparameters sigma and cost. For model tuning, we employed futility analysis (Kuhn, 2014) with random search (Bergstra & Bengio, 2012), and to evaluate model fits, the root mean square error (RMSE) was used. For each of the algorithms employed, we determined the model that obtained the lowest cross-validation RMSE and predictions were made on the test data, which had been separated from the training data at the beginning.
According to the 10 k-folds that had been created at the beginning, we repeated the process described in the previous paragraph 10 times: the second k-fold was used for testing and the remaining 9 partitions for training, then the third k-fold for testing and the remaining 9 partitions for training, and so on. After finishing this process, we evaluated the models: for each of the algorithms, we computed the average RMSE that their respective 10 final models obtained in their predictions on the test data. According to this criterion, we determined the algorithm with the lowest average RMSE and, subsequently, we evaluated its 10 “winning” models to determine the model with the lowest RMSE during the v-fold cross-validation.
Using this final model (i.e. including the k-fold number, algorithm, hyperparameters, and independent variables resulting from the feature selection), we quantified for each independent variable the global feature importance. For this purpose, we computed the Shapley values. To ensure comparable and accurate results, we used this model-agnostic method (Greenwell, 2021; Lundberg & Lee, 2017; Štrumbelj & Kononenko, 2014) with 1000 Monte Carlo repetitions.
The whole process described was applied, according to the study objectives, to each of the dependent variables. Thus, for each dependent variable, we evaluated 4000 models (10 outer folds * 10 inner folds * 5 inner fold repetitions * 8 learning algorithms) to avoid overfitting.
DATA ANALYSIS
With the MVN package (Korkmaz et al., 2014), the normality tests were performed; with psych (Revelle, 2021), the calculation of internal consistencies and Spearman correlations; with groupdata2 (Olsen, 2021), the balanced creation of k-folds; with tidymodels (Kuhn & Wickham, 2021), preprocessing of data; with Boruta (Kursa & Rudnicki, 2010), the feature selection; with caret (Kuhn, 2021) and modelgrid (Kjeldgaard, 2018), the model development (including training, hyperparameter tuning, repeated v-fold cross-validation of the inner loop, and prediction on test data sets); with fastshap (Greenwell, 2021), the Shapley values. All these packages are part of the R software (R Core Team, 2020).
COMPLIANCE WITH ETHICAL STANDARDS
The design of this research was approved by the Responsible Conduct Committee of the Faculty of Psychology of the University of Buenos Aires, Argentina (approval number: 2020.11). On the initial page of the questionnaire, we provided information about anonymous participation, the possibility of withdrawing at any time from the research, and that all information provided would remain confidential (Law No. 25, 326). After agreeing to participate through informed consent, the questionnaires were submitted. In case participants had any inconveniences or doubts, the researchers’ contact emails were disclosed. In order to protect the anonymity and confidentiality of the participants, the data source has not been validated. Thus, we did not collect participants’ email addresses and did not use any geo-localization tools.
RESULTS
Table 1 shows the final models that were selected after the nested cross-validation. According to the mean RMSE on test data and the mean RMSE of the inner-loop cross-validation, no overfitting was observed, i.e. the models were able to generalize to new data. Furthermore, it was noted that, among the final models, neither kNN nor NNET was found. Especially the NNET learning algorithm obtained RMSE that were found to be significantly higher than the other models.
Table 1
Final models that were used to compute Shapley values
[i] Note. aPrediction results on test datasets (only final models of each k-fold); b training results of the final models that resulted (within each k-fold) from the v-fold cross-validations. RMSE – root mean square error; GLM – generalized linear model; GRBF – Gaussian process with radial basis function kernel; RF – random forest; GBM – stochastic gradient boosting; SVML – regularized support vector machine (dual) with linear kernel; SVMR – support vector machines with radial basis function kernel.
In order to explore the results more comprehensively, the tables in the appendices can be consulted. In the Data accessibility statement, we provided a link that facilitates access to all supplementary material.
Using the models of Table 1, we computed the Shapley values. Age and educational level had no effects on social support variables. In comparison with educational level, age exhibited more considerable effects on symptoms, adaptive strategies and maladaptive strategies. Gender showed effects on availability of emotional support, emotional expression, search for social support, paranoid ideation, phobic anxiety, and somatization but had no effects on maladaptive strategies. Not being in psychological treatment but wishing to be had one effect: it predicted increased levels of positive refocusing. Similarly, being in psychological treatment exhibited only one effect: it predicted decreased levels of problem avoidance. On the other hand, consumption of psychotropic drugs predicted decreased levels of perceived comprehension and increased levels of anxiety.
Table 2 shows a reduced summary of the means of absolute Shapley values. Catastrophizing, self-criticism, and emotional concealment were the maladaptive strategies with the most significant effects on other maladaptive strategies. Concerning symptoms, most maladaptive strategies showed similar effect sizes. The only exceptions were problem avoidance and wishful thinking, which exhibited significantly smaller effects. Analyzing the results in more detail, the effect of self-criticism on depression and the effect of blaming others on paranoid ideation stood out.
Table 2
Matrix of mean absolute Shapley values – reduced overview
[i] Note. O – openness; C – consciousness; E – extraversion; A – agreeableness; N – neuroticism; AVES – availability of emotional support; ESRE – emotional support received; PECO – perceived comprehension; CORE – cognitive restructuring; EMEX – emotional expression; PORE – positive refocusing; PRSO – problem-solving; SESS – search for social support; BLOT – blaming others; CATA – catastrophizing; EMCO – emotional concealment; PRAV – problem avoidance; RUMI – rumination; SECR – self-criticism; WITH – wishful thinking; ANXI – anxiety; DEPR – depression; HOST – hostility; INSE – interpersonal sensitivity; OBCO – obsession-compulsion; PAID – paranoid ideation; PHAN – phobic anxiety; PSYC – psychoticism; SOMA – somatization.
Adaptive strategies did not show notable effects on symptoms but did show effects on maladaptive strategies, especially cognitive restructuring on problem avoidance, and emotional expression and search for social support on emotional concealment. Although emotional expression, problem-solving, and search for social support exhibited the most considerable mean effects on all adaptive strategies, it should be mentioned that cognitive restructuring showed a notable effect on emotional expression.
Compared to adaptive strategies, social support variables showed more considerable effects on symptoms but significantly smaller effects on maladaptive strategies. Especially emotional support received showed a striking behavior: it was not selected to predict any of the maladaptive strategies, but it was selected to predict each of the symptoms. Moreover, of the social support variables, emotional support received was the most significant predictor of adaptive strategies and availability of social support of the social support variables.
Concerning personality traits, it should be mentioned that neuroticism exhibited considerable effects on symptoms and maladaptive strategies but notably smaller effects on adaptive strategies and social support variables. In addition, consciousness showed similar behavior to emotional support received and gender: it did not predict any maladaptive strategy but most symptoms.
DISCUSSION
First of all, it should be mentioned that the third objective (to determine which variables have the most substantial effect in predicting each of the adaptive strategies and each of the social support variables) was not in tune with the social base theory (Beckes & Coan, 2011), according to which reduced access to social relationships increases cognitive and physiological effort (Coan & Maresh, 2014). This was owing to the fact that we decided to assess the reciprocal relationships between social support variables and adaptive strategies. To this extent, we intended to analyze whether social relationships have a more significant impact on adaptive strategies or vice versa. Furthermore, we also aimed to evaluate the associations within adaptive strategies, the relations within maladaptive strategies, and how social support variables are associated with each other. Since numerous studies have demonstrated that adaptive strategies reduce the likelihood of using maladaptive strategies (Augusto-Landa et al., 2011; Compas et al., 2001; Ortega et al., 2007; Qian & Yarnal, 2011; Sontag & Graber, 2010), we did not evaluate the effects that maladaptive strategies have on adaptive strategies.
On the other hand, it could be objected that simpler methods, such as correlations or multiple regressions, could be used to analyze the associations between certain variables. Although these methods make inferences, the development of more complex models could be more difficult because their results may be too tightly fitted to the characteristics of the sample. The main advantage of the supervised machine learning method is that – starting with data that are used to train the model – it allows the model’s ability to predict data that it has never seen before. In this way, it facilitates the development of complex models without over-fitting (Müller & Guido, 2011).
Following the results described above, Figure 1 shows the overall average effects obtained by the variables. Even though these results are in line with previous studies which found that, compared to adaptive strategies, social support has greater effects on well-being (Budge et al., 2013; Zeidner et al., 2016), this illustration reaffirms the two unexpected findings that were mentioned earlier: (1) although adaptive strategies do not have significant effects on symptoms, they do have considerable effects on maladaptive strategies. On the other hand, and conversely, (2) social support variables have significant effects on symptoms, while they do not have major effects on maladaptive strategies. The latter behavior was also observed concerning consciousness and gender.
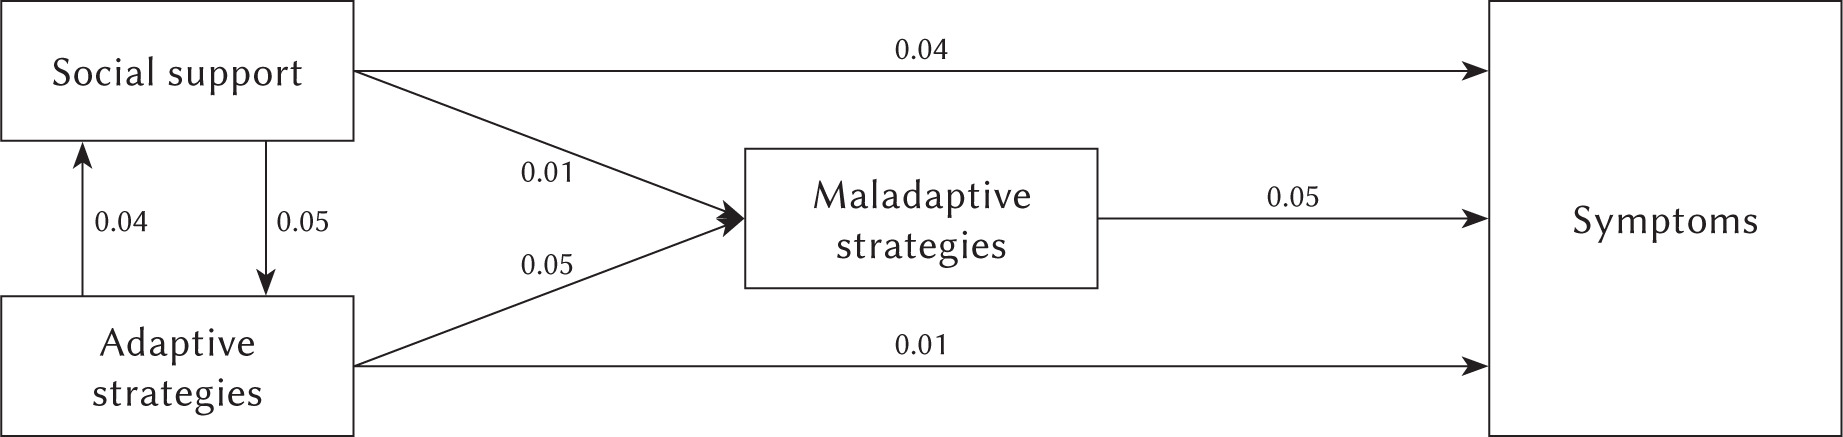
An explanation for these unexpected results could involve the possibility that the social support variables and the adaptive strategies share parts of their variances. The reciprocal effects that exist between these two would support this explanation. Accepting this possibility would automatically raise the question of causality, i.e., what is the directionality of their associations? Furthermore, this query would not only include the relationships between social support variables and adaptive strategies, but also the associations between these and maladaptive strategies and symptoms. Considering the effects described in Figure 1, the following could be stated: it is more likely that (1) adaptive strategies do not have direct effects on symptoms, but through social support, and (2) social support variables do not have direct effects on maladaptive strategies, but through adaptive strategies.
Although these statements seem plausible, it should also be noted that, as in the case of emotional support received, consciousness and gender did not exhibit effects on maladaptive strategies but did have effects on symptoms. As in the previous explanation, the results obtained lead us to intuit that maladaptive strategies and symptoms share parts of their variances. In this case, the directionality of their associations seems simpler: apparently, emotional support received, consciousness and gender do not have direct effects on maladaptive strategies, but through symptoms. Considering the nature of these variables, i.e. the difficulty to influence them, it is questionable whether symptoms are a result of maladaptive strategies. Otherwise, it seems more plausible that maladaptive strategies are the result of symptoms.
If we were to accept the possibility that this statement is correct, the result would be Figure 2, which graphically represents the relationships described above.
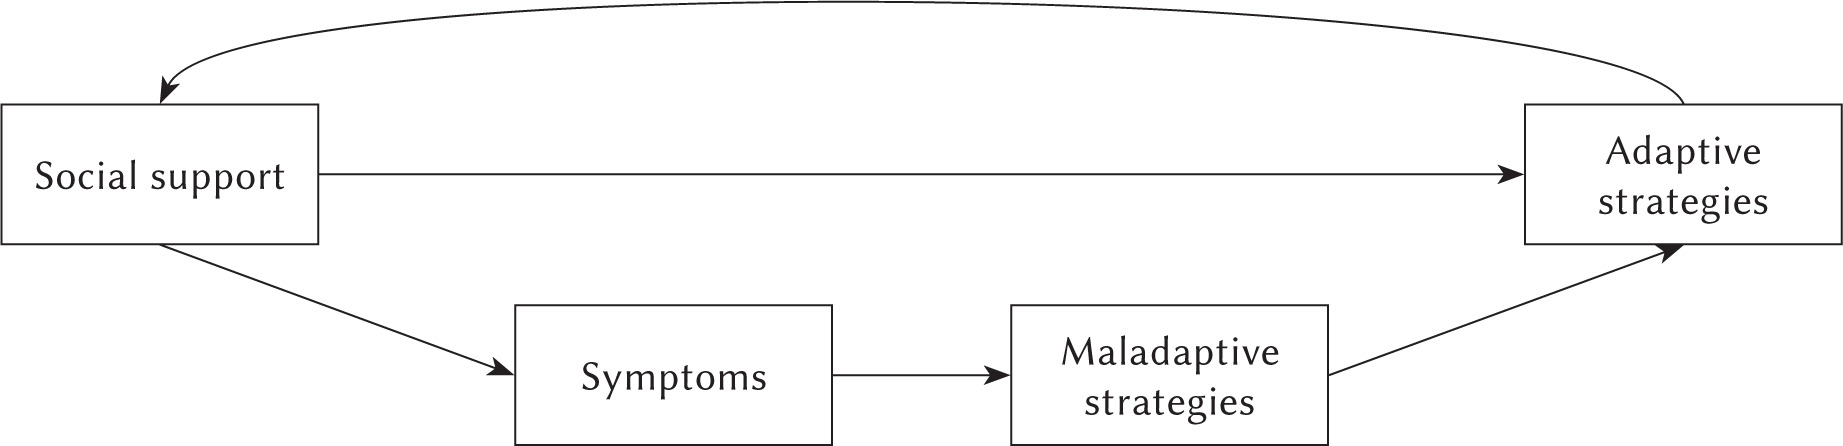
Numerous studies have found that adaptive strategies reduce the likelihood of using maladaptive strategies (Augusto-Landa et al., 2011; Compas et al., 2001; Ortega et al., 2007; Qian & Yarnal, 2011; Sontag & Graber, 2010). These studies assume not only a direction of causality but also that the effect is direct. It is important to emphasize that the explanations in the present study do not question the positive effect that adaptive strategies have on maladaptive strategies. (In fact, this direction of causality was also used in the present study to analyze the relationships between these variables.) What is questioned is how this process is carried out. According to the results (i.e. that, apparently, certain variables share parts of their variance), it is more likely that adaptive strategies have an effect on social support, social support on symptoms, and symptoms on maladaptive strategiesAs can be seen, this approach is in tune with Lazarus and Folkman’s (1984) transactional model and the emotion regulation process (Gross, 1998, 2014), but adding an important nuance. The existence of symptomatology will influence all parts comprising both processes. Concerning the transactional model, (a) during primary appraisal, meaning at the time of evaluating a potentially stressful situation as stressful, positive, controllable, changeable, or simply irrelevant; (b) during secondary appraisal, meaning the determination of available resources and coping options; (c) in the development of coping strategies. And, regarding the emotion regulation process, the existence of symptomatology will influence (1) situation selection, (2) situation modification, (3) attentional deployment, (4) appraisal/cognitive change, and (5) response modulation.
At this point, it is important to digress and analyze the items comprising the SA-45 (Sandín et al., 2008). For example, “Feeling like breaking something” (hostility), “Suddenly feeling hot or cold” (somatization), “Not feeling interested in things” (depression), “Having to do things very slowly to be sure you do them right” (obsession-compulsion), “Feeling nervous or very anxious” (anxiety), “Feeling inferior to others” (interpersonal sensitivity), “Fear of leaving home alone” (phobic anxiety), “The idea that one cannot trust most people” (paranoid ideation), “Believing that others notice one’s thoughts” (psychoticism). Without knowing the purpose of the questionnaire, one could intuit that these items describe emotional and behavioral responses to stressful situations, meaning that several items could be confused with coping or emotion regulation strategies. In this sense, the “Symptoms” box in Figure 2 would not necessarily represent acute and/or chronic conditions, but also those emotional and behavioral responses that share parts of their variance with maladaptive strategies.
Although the present study analyzed of the relationships between social support, coping and emotion regulation strategies, personality traits, and symptoms, the proposed causal relationships represent a hypothetical model which is the result of the effects found. Also, it should be noted that, although the sample of the present study can be considered relatively large, non-probability sampling was performed. Furthermore, it should be taken into consideration that this is a cross-sectional study, in which self-report instruments were used. Although a nested cross-validation was performed to prevent overfitting, future research must validate the results through longitudinal, experimental designs and/or comparisons between clinical samples and control groups. In this regard, it is essential to bear in mind that, in the present study, not only certain control variables (age, educational level, and personality traits) were included, but also all the other coping and emotion regulation variables. Thus, these variables also operated, in all calculations, as control variables. The inclusion of many variables can lead to differences with respect to studies that do not include the same variables in the model. On the other hand, it should also be emphasized that depression was not used as a control variable in the calculations performed. This factor should be included in future studies to evaluate the relationships described in the hypothetical model. Finally, it is important to emphasize that the hypothetical model was proposed as a deduction from the results obtained. To summarize, it is necessary to conduct future research based on experimental and/or longitudinal designs to evaluate these relationships.
CONCLUSIONS
Within the context of regulatory flexibility, the importance of the availability of a repertoire of regulatory strategies is considered (Bonanno & Burton, 2013). Despite the importance of this repertoire for an individual’s long-term adaptation, the main function of this repertoire does not appear to be a better adaptation to situations, but rather the maintenance of adequate levels of social support, i.e. emotional support received, perception of available emotional support, and perceived comprehension. This assertion is because these variables have more considerable effects in reducing the symptoms analyzed. (The most significant effects were: emotional support received on anxiety, and phobic anxiety; availability of emotional support on depression, interpersonal sensitivity, and somatization; perceived comprehension on hostility, interpersonal sensitivity, obsession-compulsion, paranoid ideation, and psychoticism.)
Considering the results of the present study, the importance of the concept of interpersonal emotional regulation (Zaki & Williams, 2013) and the social baseline theory and the social regulation of emotion (Coan & Maresh, 2014) stands out. Diminished perception of available and/or received emotional support significantly affects the symptoms analyzed and, whether conceptualized as a cognitive bias or not, the question arises as to how effective training based on stimulating the perception of available and/or received emotional support could be. This question is mainly based on the transcendental role cognitive restructuring plays in the study of emotion regulation (Gross, 2014; Gross & John, 2003) and on the positive results obtained in direct cognitive restructuring training (Halperin et al., 2013; Halperin & Gross, 2011).
DATA ACCESSIBILITY STATEMENT
The data that support the findings of this study (Database, R Studio project and workspace, R Script, tables with detailed information) are openly available at: https://osf.io/wa8dj/?view_only=e2ba32c9c238400492ef7e963f1aeaa5