BACKGROUND
Since on 11 March 2020 the World Health Organization declared the outbreak of COVID-19 a pandemic, an impressive number of scientific articles have been published exploring the impact of the outbreak on symptoms of mental distress in different populations, in addition to major research efforts to develop effective vaccines and treatments for the disease. Researchers in the fields of psychology and public health medicine have studied the effects of national measures limiting the activities and movement of citizens on their psychological distress (Panda et al., 2021), the impact on mental health of health care workers infected/exposed to COVID-19 (Salazar de Pablo et al., 2020), and the mortality and severity of COVID-19 among patients with mental disorders (Toubasi et al., 2021).
Importantly, the need to maintain physical and social distance between people and the stay-at-home recommendation/order have raised concerns about the potential increase in loneliness and its negative consequences for physical and mental health. According to Killeen (1998), the term loneliness refers to the psychological experience and the emotional suffering of being alone. The author defined loneliness as “a condition that describes the distressing, depressing, dehumanizing, detached feelings that a person endures when there is a gaping emptiness in their life due to an unfulfilled social and/or emotional life” (p. 764). It is generally related to some other concepts with a different meaning. For example, aloneness indicates the condition of being by themselves, but differently from loneliness, it is characterized by an element of choice, a preference for being alone than with other people (Killeen, 1998). Solitude has a more optimistic sense because it refers to the calming and regenerating function of being alone. Social withdrawal refers to processes and behaviors through which one moves voluntarily away from opportunities for social interaction, whereas social isolation refers to active exclusion from social activities by peers and/or to an objective measure of lack of social relationships or rare social contacts with others (Freak-Poli et al., 2022; Rubin et al., 2009). Loneliness correlates with different indicators of physical and mental health such as chronic diseases, high cholesterol levels, diabetes, health impairment, psychological distress and depression (Loades et al., 2020; Richard et al., 2017). A recent comprehensive review and meta-analysis showed that loneliness had medium to large effects on depression, anxiety, suicidality, overall self-rated health, quality of life, life satisfaction, functional disability, sleep and cognition (Park et al., 2020). Furthermore, in the general population loneliness was found to have a harmful effect on all-cause mortality (Rico-Uribe et al., 2018). The age distribution of loneliness follows a non-linear trajectory, with elevated levels during young adulthood and older adulthood (Luhmann & Hawkley, 2016). Therefore, loneliness of emerging and young adults needs to be closely monitored during the COVID-19 pandemic considering the changes that occurred in their daily habits, which were disrupted by the pandemic, due to the impossibility to attend the workplace/education, the interruption of most sports activities, the closure of meeting places and entertainment venues, and the reduction of the number of social encounters. As a consequence, several cross-sectional studies have explored loneliness among young adults during the COVID-19 pandemic (Arslan et al., 2022; Besser et al., 2022; Horigian et al., 2021; Lippke et al., 2021; Marchini et al., 2021; Mosanya, 2021; Sutin et al., 2020). However, longitudinal studies analyzing trends or changes in loneliness during the pandemic with samples of young adults have been limited. Lee et al. (2020) showed a worsening trajectory of loneliness between pre-pandemic and pandemic periods (i.e., January 2020 and April/May 2020, respectively) in a sample of 564 U.S. young adults. In addition, Okruszek et al. (2020) found no changes in loneliness among Poland young adults (mainly students) during the first two weeks of national restrictions introduced due to the pandemic. Hu and Gutman (2021) examined loneliness trajectories in 419 UK young adults between June and November 2020. Their findings showed a U-shape longitudinal trend in loneliness, with a sudden increase during the winter months and national lockdown. Similarly, Killgore et al. (2020) analyzed trends in loneliness among 6,186 U.S. adults between April and September 2020. The authors concluded that loneliness increased over the 6-month period controlling for age, sex and primary job loss due to COVID-19. These changes may be related to seasonal variations but also to national restrictions, with effects hard to disentangle (Hu & Gutman, 2021). Despite the overall lack of evidence on seasonal variations in loneliness among young adults of the general population, two previous studies explored seasonal variations in loneliness with small sample sizes. Victor et al. (2015) investigated the trend in loneliness in 28 older adults (age range: 65-93 years) between June 2012 and June 2013 in the United Kingdom. The percentage of participants reporting that they were “never/rarely” lonely was highest in winter (i.e., December) and spring (March) and lowest in the summer (June) and autumn (September). Furthermore, loneliness was stable in 50% of the sample. Among participants who showed changes, loneliness mainly decreased between the autumn and the winter, while it increased between the spring and the summer (Victor et al., 2015). Wenz (1977) examined present and future loneliness in 110 subjects with a mean age of 26.7 years who attempted suicide in the USA. Both forms of loneliness seemed to be higher during the spring and the winter than in the summer and the autumn. Those two studies are characterized by some differences (e.g., study population) and relevant methodological limitations (e.g., small sample size, no covariate adjustment) and, consequently, showed conflicting findings with respect to possible loneliness seasonality.
In light of the above, the first aim of this study was to examine the loneliness trend in university students during the first year of the COVID-19 pandemic (i.e., between April 2020 and March 2021). Based on recent evidence in samples of adult populations (Hu & Gutman, 2021; Killgore et al., 2020), we hypothesized an increase in loneliness during the first pandemic year and periods of more stringent national public health measures implemented to contain the spread of the infection.
Studies exploring factors associated with loneliness during the pandemic showed associations with younger age, being single, living alone, poor job security, smaller accommodation, having a poor relationship with the person/people sharing quarantine, COVID-19-related social concerns, physical and mental health conditions (Alheneidi et al., 2021; Bareket-Bojmel et al., 2021; Groarke et al., 2020; Grossman et al., 2021; Lee et al., 2020; Rosenberg et al., 2021). Self-isolating because of being at high risk of infection or by order also increased the probability of reporting loneliness (Groarke et al., 2020). Vanderbruggen et al. (2020) found that boredom was the top reason for consuming more cigarettes and cannabis, and the fifth for consuming more alcohol during the COVID-19 measures compared to before among Belgian adults. Furthermore, a previous study (Chin et al., 2017) identified a significant association between boredom and loneliness in a large sample of U.S. adults, highlighting that boredom emerges from situations in which engagement is challenging (e.g., contexts where one’s autonomy might be constrained, sedentary activities).
Pre-pandemic evidence suggested that symptoms of psychological distress were higher in students of some non-medical faculties than in those of medical faculties (Diehl et al., 2018). For example, Pakistani social sciences and engineering students reported higher symptoms of depression, anxiety, and stress than medical students, while no significant between-group difference was found for suicidal ideation or life satisfaction (Naseem & Munaf, 2017). In another study Thai students at the Faculty of Humanities reported higher stress and sleep deprivation than medical students, while there was no between-group difference for depression, excessive daytime sleepiness or overweight (Kongsomboon, 2010). Similarly, Saudi Arabian students at the Faculty of Education showed higher anxiety than medical students, while there was no between-group difference in symptoms of depression and stress (Mirza et al., 2021). Therefore, the second aim of the study was to explore the relationships between loneliness and students’ well-being, COVID-19-related variables (i.e., COVID-19 students’ life at home) and COVID-19 symptoms and tests. Considering the evidence discussed above, we expected loneliness to be associated positively with being enrolled at the Department of Humanities, Social Sciences and Engineering rather than Health Professions, more tension and conflict at home, boredom, feeling locked up, poor subjective well-being and health status, COVID-19 symptoms and tests. Negative associations were expected between loneliness and age, strengthened neighborhood, and enjoying time spent with family/partner at home.
PARTICIPANTS AND PROCEDURE
PARTICIPANTS
This study uses data from the Health in Students study during the COVID-19 pandemic (HES-C), an open cohort online study exploring the impact of the COVID-19 pandemic on psychophysical health of students at the Zurich University of Applied Sciences (ZHAW) in Switzerland. More specifically, the study aims to (1) evaluate the health of students during the pandemic, (2) investigate changes in health behavior and associated factors, and (3) assess students’ perception of the pandemic and related measures and their impact on students’ lives. All students enrolled at the ZHAW (N approximately 13,500) received a non-personalized email inviting them to participate in the study, providing study information, and a link to the survey and the study homepage. Students were repeatedly invited to participate in nine consecutive web surveys that were administered between April 2020 and June 2021. To capture the dynamics of the pandemic and its effects during the semester and teaching classes, three surveys per semester were conducted. The intervals between surveys ranged from 4 to 8 weeks, with breaks during the semester breaks. Surveys were administered at shorter intervals at the beginning of the pandemic and at longer intervals beginning in fall 2020 to reduce the response burden on students who wished to participate in the survey at multiple times. Response rates, number of participants (n) and completion rates (CR) in the nine surveys were 18.0% (n = 2,429, CR = 83.3%), 10.6% (n = 1,473, CR = 97.5%), 9.4% (n = 1,271, CR = 95.0%), 9.4% (n = 1,264, CR = 66.1%), 8.9% (n = 1,203, CR = 94.2%), 11.3% (n = 1,527, CR = 91.0%), 5.7% (n = 776, CR = 86.5%), 7.9% (n = 1,066, CR = 89.4%), and 5.4% (n = 730, CR = 88.5%).
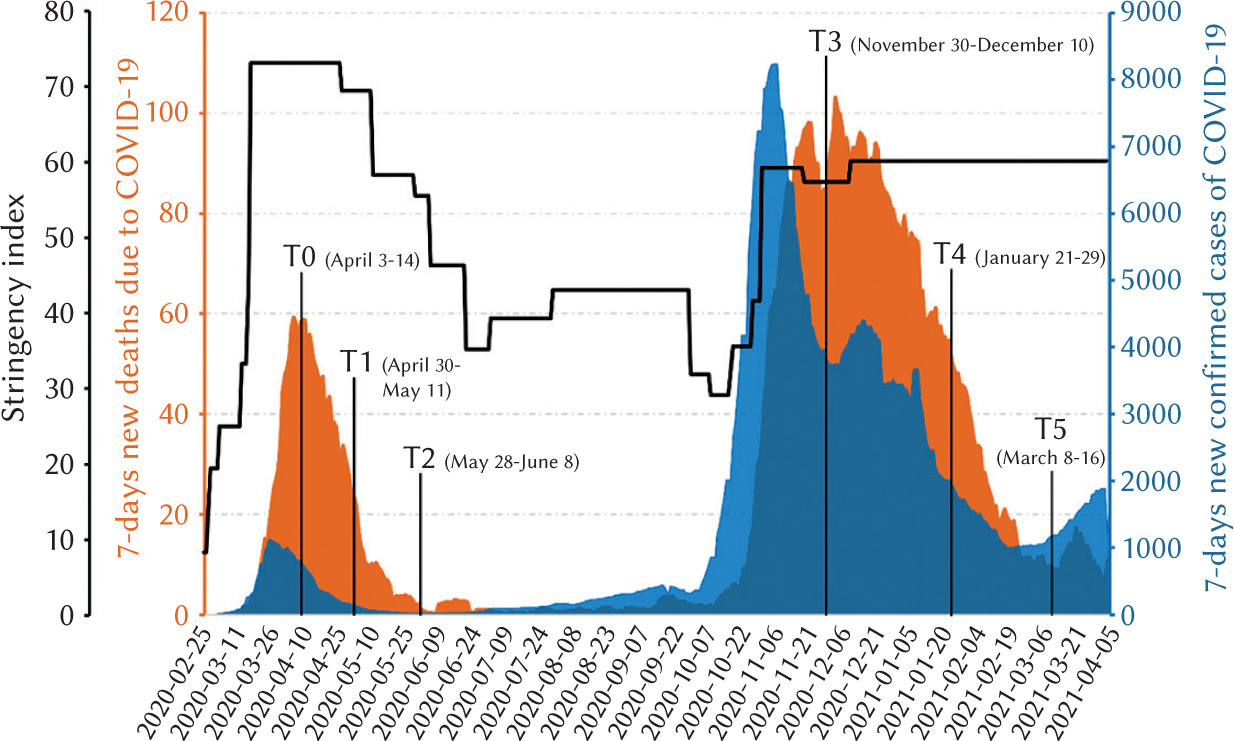
In the present study, we report the results of the analysis of the first participation response of university students (N = 5,669) for six online surveys during the pandemic year., i.e., between April 2020 and March 2021. In other words, we analyze pooled repeated cross-sectional data with independent samples of university students collected during the first year of the COVID-19 pandemic. Data from one survey, the third one, were excluded because no information on loneliness was collected. Participants were distributed according to survey time as follows: 2,332 in April 3-14, 2020 (survey time indicated with April 2020, Time 0, T0), 723 in April 30-May 11, 2020 (May 2020, T1), 458 in May 28-June 8, 2020 (June 2020, T2), 725 in November 30-December 10, 2020 (December 2020, T3), 995 in January 21-29, 2021 (January 2021, T4) and 436 in March 8-16, 2021 (March 2021, T5). Each survey lasted about 20-25 minutes and ran for a total of seven working days. Dratva et al. (2020) published study methods and questionnaire construction in detail. Figure 1 shows trends in confirmed COVID-19 cases and deaths (7-day moving average) and stringency index data (Hale et al., 2020) in Switzerland from February 25, 2020 to April 6, 2021. Table S1 (Supplementary materials) reports more details on survey periods for participation and concomitant national restrictions in Switzerland.
Figure 1
National epidemic trends of the 7-day moving average of confirmed cases (blue) and new deaths (orange) due to COVID-19 and stringency index (black line) in Switzerland from February 25, 2020 to April 6, 2021
Participants’ informed consent was obtained before filling in the set of questions online. Specifically, study information and a link to the survey and study homepage were provided on the first introductory page to the study. Students were asked to agree to the conditions and when they continued with the questionnaire, they gave their consent to participate in this study. Anonymity of participants was ensured by asking them to generate a personal code at the start of each web survey. The study was approved by both the local cantonal ethics committee (BASEC-Nr. Req-2020-00366) and the ZHAW data protection officer.
MEASURES
The following information was recorded at each of the six surveys.
Demographic variables. Participants provided demographic information, including age, gender and ZHAW department attended.
Well-being. Current health status and subjective well-being were explored using the two following questions: “What is your current state of health?” and “How are you doing right now?”, respectively. Students were asked to respond to the questions on a 5-point Likert scale ranging from 1 (very bad) to 5 (very good). Responses were then recoded as 1 (good, very good), 2 (average) and 3 (bad, very bad). For a summary of research questions and variables see also Table S2 (Supplementary materials).
COVID-19-related variables. A set of questions on COVID-19 students’ life at home was specifically developed for this target group and their context. The questions were developed by the authors representing researchers, lecturers and students. Five students of different faculties piloted the questionnaire, reporting any technical and content issues in a debriefing session with the authors. Moreover, the questionnaire was subject to a round table expert review.
Students were asked about the effects of the COVID-19 pandemic and the public health measures on their everyday life at home (instructions for filling in the set of questions: “The pandemic regulations can have various effects on everyday life at home. To what extent do you agree with the following statements?”). They were asked to agree or not agree with statements by responding on a 5-point Likert scale ranging from 1 (completely disagree) to 5 (completely agree). Furthermore, they had the opportunity of indicating that the statement was irrelevant (not relevant). Students’ loneliness (“I am lonely”), experience of tension and conflict (“I experience more tensions and conflicts”), neighborhood (“I experience a strengthened neighborhood”), boredom (“I am bored”), feeling locked up (“I feel locked up”), enjoying time with family (“I enjoy spending time with my family/partner”). Responses were then recoded as 1 (I disagree completely, I tend to disagree), 2 (partially disagree and partially agree), 3 (I tend to agree, I completely agree) and 4 (not relevant), except for responses on loneliness, which were recoded differently.
Regarding loneliness, 18 participants responded with “not relevant” to the statement exploring it, while 74 responses were missing. Therefore, those participants (n = 92) were not included in the study analyses because they did not provide useful information on the experience of loneliness. Loneliness responses were dichotomized as absent (0 – I disagree completely, I tend to disagree, partially disagree and partially agree) or present (1 – I tend to agree, I completely agree).
COVID-19 symptoms and tests. Students’ symptoms and testing for COVID-19 were assessed using the following statements with dichotomous response options (no, yes): “Have you had symptoms in the past 4 weeks that would be compatible with a COVID-19 infection? For example, cough (usually dry), sore throat, shortness of breath, fever, muscle pain”; “Have you had a COVID-19 test in the past 4 weeks?”; “Have you tested positive for COVID-19?”.
STATISTICAL ANALYSES
Descriptive statistics (i.e., frequencies, prevalence, mean, standard deviation) were applied to evaluate the characteristics of the sample according to the survey. Univariate analysis of variance (ANOVA) and the chi-square test of independence were used to investigate differences in age and gender, respectively, according to the survey. Cramer’s V was used to express effect size in the latter analysis. Furthermore, ANOVA and the chi-square test were used to compare included and excluded participants for observed characteristics. Subsequently, we used a logistic regression model to examine trends in loneliness as well as the associations between loneliness and variables of interest. Initially, all predictors of loneliness were fitted separately (i.e., bivariate association) (unadjusted model); subsequently, the associations were analyzed controlling for age, gender and ZHAW department (adjusted model 1); in the final model (adjusted model 2) all measures were fitted jointly to determine the unique relevance of predictors after accounting for the influence of all other predictors. Odds ratios (OR) with corresponding 95% confidence interval, and p values were reported. As part of a sensitivity analysis, we fitted the models using ordinal regression models (i.e., without recoding the variables). P values < .05 were considered statistically significant. All data were analyzed using SPSS Version 25.
RESULTS
Differences between included (N = 5,669) and excluded (N = 92) participants are shown in Table S3 in Supplementary materials. Participants included were younger than those excluded. Further, differences in distribution of responses were found for more tension/conflict (participants excluded more likely showed agreement with more tension/conflict and missing responses than those included), boredom, feeling locked up and enjoying family (participants excluded more likely showed not relevant and/or missing responses than those included), and subjective well-being (participants excluded more likely showed agreement with poor subjective well-being and missing responses than those included). No between-group difference was observed for gender, department, survey, strengthened neighborhood, health status, and COVID-19 symptoms and test. 5,669 university students (mean age = 26.10, SD = 5.78; 67.6% female, 31.9% male, 0.5% other) constituted the final total sample for this study. Table 1 shows sample characteristics according to the survey.
Table 1
Sample characteristics and COVID-19 effects at home by survey
In April 2020 (T0), 30.1% of ZHAW university students reported loneliness, 27% in May 2020 (T1), 25.8% in June 2020 (T2), 40.7% in December 2020 (T3), 41.3% January 2021 (T4) and 43.1% in March 2021 (T5).
Participants differed in age (F(5, 5662) = 16.18, p < .001, ƞ2 = .01), gender (χ2 = 26.61, df = 10, p = .003, Cramer’s V = 0.05) and ZHAW department (χ2 = 116.58, df = 35, p < .001, Cramer’s V = 0.06) according to the survey (percentages are reported in Table 1). Since age, gender and department distribution were not homogeneous within groups, these variables were included as covariates in logistic regressions (i.e., adjusted model 1).
Survey was significantly associated with loneliness controlling for age, gender and department (Table 2, adjusted model 1). Loneliness decreased between April 2020 (T0) and May-June 2020 (T1 and T2). In contrast, students who participated in the study in December 2020 (T3), January and March 2021 (T3 and T4) were more likely to report loneliness than those who participated in April 2020 (T0). Figure 2A shows estimated marginal probabilities of reporting loneliness by survey controlling for the effects of age, gender and department.
Table 2
Odds ratios and confidence intervals (95%) from logistic regression models of loneliness during COVID-19 pandemic
[i] Note. Ref – reference category; abivariate associations; bassociations analyzed controlling for the effects of age, gender and department; call variables fitted jointly; χ 2 – chi-square of the omnibus test of model coefficients; df – degree of freedom, R2 – Nagelkerke R2; T0 – April 2020, T1 – May 2020, T2 – June 2020, T3 – December 2020, T4 – January 2021, T5 – March 2021. *p < .05, **p < .01, ***p < .001.
Figure 2
The estimated marginal effect of survey wave on the probability of reporting loneliness in A: adjusted model 1, and B: adjusted model 2. Error bars represent the 95% confidence intervals

Furthermore, nearly all factors were associated with loneliness when controlled for age, gender and department, except for COVID-19 symptoms during the past four weeks (Table 2, adjusted model 1).
When all factors were jointly modeled (Table 2, adjusted model 2), the effect of gender, strengthened neighborhood and COVID-19 test became statistically non-significant. Survey was still significantly associated with loneliness. In particular, there were no differences in probability of reporting loneliness during April, May and June 2020 (T0, T1 and T2, respectively). However, students who participated in December 2020 (T3) and March 2021 (T5) were more likely to report loneliness than those who participated in April 2020 (T0), controlling for the effects of all other variables (see also Figure 2b). Furthermore, the probability of reporting higher loneliness in January 2021 (T4) than in April 2020 (T0) was borderline significant (p = .051).
Students at the Department of Architecture, Design and Civil Engineering and those at the Department of Engineering were more likely to report loneliness than students at the Department of Health Professions.
Answering with partly or not relevant to the statement on experiencing more tensions and conflicts at home was associated with increased occurrence of loneliness compared to a negative response. Furthermore, the effect of the experience of more tensions and conflicts (“yes”) was borderline significant (p = .053). Specifically, students who reported more tensions and conflicts at home were more likely to show loneliness compared to those who did not. Boredom, feeling locked up and poor subjective well-being and current health (as compared to good) were robustly associated with loneliness. Finally, older age and enjoying time spent with family/partner were protective factors for feelings of loneliness. The multivariable model (χ2 = 1410.09, df = 36, p < .001) explained between 24.2% (Cox & Snell R2) and 33.7% (Nagelkerke R2) of the variance in loneliness during the first year of the COVID-19 pandemic.
The results of the sensitivity analyses using ordinal regression models (Table S4 in Supplementary materials) yielded comparable findings except for the non-significant difference between students at the Department of Engineering and those at the Department of Health Professions in reporting loneliness.
DISCUSSION
The findings of our study showed a significant decrease in loneliness during the first wave of the COVID-19 pandemic in Switzerland between April 2020 (prevalence of 31%) and May-June 2020 (25%), concomitantly to the easing of national restrictions (see also stringency index trend in Figure 1). However, during the second wave of the COVID-19 pandemic (i.e., December 2020-March 2021) loneliness was higher (40-43%) than in April 2020 and national restrictions were stringent and mainly stable. To our knowledge, this study is the first to examine trends in loneliness among university students during the first year of the COVID-19 pandemic. These results expand previous knowledge on loneliness during the first pandemic year (Hu & Gutman, 2021; Killgore et al., 2020). Our findings indicate that loneliness decreased during the first wave of COVID-19 as national restrictions were eased, while it increased during the second wave of the pandemic with more stringent national restrictions, confirming our first hypothesis. National restrictions may have had a negative impact on loneliness, limiting social encounters (Luhmann & Hawkley, 2016). However a possible effect of seasonal variation should be kept in mind. Loneliness was higher in March 2021 than in April 2020. Further, in March 2021 COVID-19 confirmed cases and deaths decreased (see Figure 1), whereas in April 2020 they peaked with no apparent difference in national restrictions. Therefore, it is plausible that a seasonality effect may have occurred besides the impact of national restrictions on loneliness. Another explanation considers the possibility that the second wave of COVID-19 may have been perceived as more stressful than the first one, increasing students’ psychological distress and loneliness. Indeed, differences in psychological wellbeing and suicide mortality between the first and the second wave of the COVID-19 pandemic have also been reported (Sønderskov et al., 2021; Tanaka & Okamoto, 2021). Future studies should examine seasonal variations in loneliness to clarify our study findings.
Regarding the second aim of the study, we found significant associations between loneliness and various factors. In particular, students with an older age were less likely to report loneliness, in line with findings of previous studies conducted before (Luhmann & Hawkley, 2016) and during (Bu et al., 2020; Groarke et al., 2020) the COVID-19 pandemic in adult populations. Considering the high engagement in social activity in normal life, national restrictive measures to contain the spread of the contagion (especially, the closures of universities, sport centers and pubs/clubs) may have exerted a stronger impact on feelings of loneliness among younger university students, especially those who recently joined the university, as compared to older students. Furthermore, our findings highlight the importance of social support as well as the quality of relationships, indicating that enjoying time spent with family/partner was negatively associated with loneliness while experiencing more tensions and conflicts at home was positively associated with it. Accordingly, recent studies showed that being single, living alone and having a poor relationship with the person/people sharing quarantine were associated with loneliness (Bu et al., 2020; Groarke et al., 2020; Rosenberg et al., 2021). Despite evidence for a particular impact on health profession students (Alsairafi et al., 2021; Loda et al., 2020; Rana et al., 2020), we found them less likely to show loneliness as compared to students at the Department of Architecture, Design and Civil Engineering and at the Department of Engineering over the period under investigation, in line with findings of studies conducted before the COVID-19 pandemic (Diehl et al., 2018; Kongsomboon, 2010; Mirza et al., 2021; Naseem & Munaf, 2017). On the other hand, no significant difference in loneliness was observed between students at the Department of Health Professions and those at the Departments of Applied Linguistics, Applied Psychology, Life Sciences and Facility Management, Management and Law, and Social Work. While we cannot rule out the influence of pre-existing (i.e., pre-pandemic) differences in loneliness – or in factors related to loneliness such as personality (Vedel, 2016) – between students at different departments, our results showed that students at the Department of Architecture, Design and Civil Engineering and at the Department of Engineering were at higher risk of loneliness compared to students at the Department of Health Professions during the first year of COVID-19 pandemic, suggesting a possible stronger negative role of social distancing measures and/or online educational activities for some students (e.g., possible differences in distance learning by faculty). Another explanation involves the possibility that health profession students had acquired more effective ways of coping with psychological stress because of their curricula (e.g., courses) compared to students at the Department of Architecture, Design and Civil Engineering and at the Department of Engineering. However, the results regarding students at the Department of Engineering should be interpreted with caution because sensitivity analyses showed a non-significant difference between students at the Department of Engineering and those at the Department of Health Professions in reporting loneliness.
We observed that students who reported boredom and feeling locked up were more likely to show loneliness than those who did not, in line with previous evidence (Chin et al., 2017; Vanderbruggen et al., 2020). Finally, in line with findings of previous studies (Groarke et al., 2020; Rosenberg et al., 2021), students who reported poor subjective well-being and current health were more likely to show loneliness than those who did not. These findings are in line with those of a previous study conducted with a national representative sample of the Swiss population aged 15 and over (Richard et al., 2017).
IMPLICATIONS
Taken together, the results of our study showed that many university students felt lonely during the first year of the COVID-19 pandemic and that variables related to students’ life at home were associated with loneliness. Students at the Department of Architecture, Design and Civil Engineering and at the Department of Engineering were more likely to self-report loneliness. These findings have implications for educational institutions, clinical practice, and public health. In particular, they underscore the need for educational institutions to not only provide access to mental health services for students with study-related or personal problems during unexpected and sudden stressful situations such as the COVID-19 pandemic, but also to increase their counselling services and promote their use. Differences in loneliness found in students of some departments suggest the importance of considering the inclusion, in the curricula, of brief intervention workshops focused on emotion regulation and psychological distress. The use of university counselling services may further support students’ mental health in synergy with educational workshops. Future research is necessary to examine more closely differences in students’ loneliness and mental health by faculty. In addition, the effect of such educational workshops in enhancing the psychological well-being of students, also combined with individual and/or group support, may be tested in the university setting. Clinicians should also consider that in addition to tensions related to conflicts at home or the need to take care of family members, academic concerns, struggles with online teaching, and changes in current and future plans of students must be addressed, especially in those who had strained relationships with family (Lee et al., 2020). Regarding implications for public health, in both target groups specific and more general interventions are needed. Van Dyck et al. (2020) for example suggested that lonely students could benefit from social interventions aimed at reducing loneliness of nursing home residents. In the authors’ program, university student volunteers were paired with elderly residents and provided weekly friendly phone calls. Other than alleviating social isolation experienced by nursing home residents, the program positively impacted student volunteers, with students reporting a greater sense of purpose and feelings of social connectedness (van Dyck et al., 2020). Although these were initial findings, they suggest the possibility that two groups at risk for psychological distress (college students and older adults) may mutually support each other through a telephone intervention program aimed at countering loneliness during a time of crisis. Further, Switzerland allowed young people more mobility and activities, such as participating sportive or cultural activities (The Federal Council, 2021), once the associated mental health burden for adolescents became clear, and, lastly, ensuring sufficient mental health services irrespective of the pandemic is central.
LIMITATIONS
Some limitations should be considered in interpreting the study findings. First, this is a repeated cross-sectional study, and the samples of participants may not be directly comparable despite their similarities (e.g., students enrolled at the same university, multivariate analysis covaried for the effects of age, gender and ZHAW department). Second, data were collected using single-item self-report measures, which may produce response biases due to social desirability. Loneliness was measured using a Likert agree/disagree item, generally of lower quality compared to item-specific response options due to acquiescence bias (Saris et al., 2010). As a consequence the percentages of loneliness found in the present study could represent an overestimation of lonely students, although they were in line with those of another study conducted during the COVID-19 pandemic (Horigian et al., 2021). Regarding factors associated with loneliness, we conducted sensitivity analysis that yielded comparable results. Furthermore, considering that excluded participants were younger, showed more tension and poor subjective well-being, we could have missed a group of participants at risk for loneliness. However, at the same time, effect sizes of those differences were small (as indicated by values of η2 and Cramer’s V). Finally, a specific population of Swiss university students participated in the study, limiting generalizability of the findings to other population (e.g., different age groups, different geographic areas, clinical populations). Despite these limitations, this study offers valuable knowledge of the loneliness trend and its relationships with other variables during the first year of the COVID-19 pandemic among Swiss university students. Previous research was mainly limited by the cross-sectional nature of the studies or short periods of follow-up.
CONCLUSIONS
Our findings revealed a significant decrease in loneliness during the first wave of COVID-19 in Switzerland between April 2020 and May-June 2020, while, during the second wave of COVID-19 (i.e., December 2020-March 2021) loneliness was higher than in April 2020. However, we cannot rule out a possible effect related to seasonality variations in loneliness. Sociodemographic variables such as younger age and studying architecture, design and civil engineering or engineering, and variables related to students’ life at home, such as not enjoying time spent with family/partner, experiencing tensions and conflicts at home, boredom, feeling locked up and poor subjective well-being and current health, were associated with loneliness. These results should stimulate the attention of educational institutions and public health systems in monitoring the effects of social distancing measures and reduced social contacts on students’ loneliness, as well as its possible negative consequences for psychophysical health of young people during a pandemic crisis. The inclusion, in the university curricula, of educational workshops on emotion regulation and psychological distress as well as conducting social interventions aiming at reducing loneliness via weekly encounters and/or calls may represent a valuable contribution of future research in sustaining students’ mental health.
Supplementary material is available on the journal’s website.