BACKGROUND
For more than half a century, many countries across the world have undertaken numerous measures, studies, and analyses in order to identify the best ways to promote the activity and participation of children, youth, and adults with various special needs in social life. One of the first specific instruments was the law established in 1950s in Denmark and Sweden with the aim to “make available to all mentally retarded people patterns of life and conditions of everyday living which are as close as possible to the regular circumstances and ways of life of a society” (Bak-Mikkelsen, 1980; Nirje, 1960; as quoted in Emmerson, 1998, p. 2). It is better known as the “idea of normalisation” of the life of all individuals with functional limitations, and as such, it quickly spread across the world. More than three decades ago, the “idea of normalisation” also permeated education, first as early intervention/ stimulation in young children diagnosed with developmental disorders and then to higher stages of education of pupils with special educational needs. Currently, it is also present in post-secondary education, i.e. students with intellectual disability attend colleges together with their peers without disability (Grigal & Hart, 2010; Madaus et al., 2021). In the early stages, the idea of normalisation in education focused mainly on integration in education, but over the years, it was determined that such organisational form does not ensure full participation in social life to all. The next step, which is the current trend, was inclusive education. A great part of the literature of the subject suggests that “inclusion is often associated with students who have impairments or students seen as having special educational needs. However, inclusion is about the education of all children and young people” (Booth & Ainscow, 2011, p. 1).
Ensuring high quality education for all in inclusive schools, where students with and without disability pursue their educational needs together, is a major challenge for many European educational systems (Booth & Ainscow, 2011; Kefallinou & Donnelly, 2019). According to the Polish Ministry of Education and Science, in 2022, more than 70% of pupils with special educational needs attended inclusive primary and secondary schools and less than 30% were enrolled in special schools (MEN, 2022). These data clearly suggest that inclusive education is becoming a fact and consideration should be given to educational measures that will yield the best results for all the individuals who constitute the human capital of inclusive educational institutions (Hughes et al., 2020; Walczak, 2011).
This trend in the European system of education indicates the priority directions for scientific research and analyses needed to support the implementing measures undertaken by the respective countries within the model of “high quality education for all learners” that will guarantee normalisation of life for children, youth and adults in terms of their education. In response to this need, a number of studies have been undertaken to identify various (institutional and personal) indicators of the readiness of mainstream educational institutions to provide high quality education for all learners (Kessel et al., 2021; Kranzler et al., 2020).
This report presents the results of one of such study, the goal of which was to explain to what extent emotions experienced at work are a predictor of the level of teacher job satisfaction. An analysis of the distribution of the results for the studied variables among inclusive and special school teachers was also supposed to show how well prepared they are to work with a diversified classroom, especially in an inclusive educational institution. Moreover, the moderator role of the type of school – inclusive or special – for this correlation was analysed.
THEORETICAL CONTEXT OF THE STUDY
Szumski (2019, p. 15) explains that “inclusive education is not a homogeneous theoretical and practical conception, but different ways of its understanding complement each other. In contemporary special education a notion of inclusive education is used in a descriptive and prescriptive meaning. In the first meaning, it is a form of common learning of students with and without disability in one classroom. In the latter, inclusive education is a project of school system reform, which aims to build a common, high-quality school for all students”. Inclusive education differs from non-inclusive education in that it offers access to mainstream schools to all pupils and balanced educational aims, ensures harmonious development of the students, specialized support, school staff cooperating with each other, and a universally designed curriculum (Szumski, 2019).
The specificity of inclusive education is also explained through the fact that it had been for a long time perceived as a specific organization (Griffith, 2006; Handy, 1986; Perkowska-Klejman & GórkaStrzałkowska, 2016). A closer look within this trend of analysis would require exploring the concept of diversity management and the possible benefits of this diversity for the effectiveness of the organization (Kirton & Greene, 2010). The specificity of inclusive educational institutions is due to the fact that their human capital comprises not only the diversity of personnel but also the diversity of pupils (with and without disability) and of the social environment (parents of pupils). The results of existing research clearly suggest that such diversity may be beneficial for school as an organization (Kirton & Greene, 2010) as well as for every individual that constitutes its human capital (Blecker & Boakes, 2010; Marciniak-Parocka, 2017; Most & Ingber, 2016; Ruijs, 2017).
Recently, inclusive education has been the object of various theoretical deliberations and scientific studies. A number of studies from different countries focus on the attitudes of teachers towards inclusive education (Avramidis et al., 2000; Avramidis & Norwich, 2002; de Boer et al., 2011; Lifshitz et al., 2004; Rakap & Kaczmarek, 2010), and of parents (Marciniak-Paprocka, 2017; Most & Ingber, 2016). Also, the parent evaluation of the inclusive education process is examined (Gallagher et al., 2000; Peck et al., 2004). Results of research on the effects of inclusive education for pupils with and without disability are also available (Black-Hawkins et al., 2007; Dessemontet et al., 2012; Donelly & Kefallinou, 2018; Peetsma et al., 2001; Ruijs & Peetsma, 2009; Ruijs, 2017; Szumski & Firkowska-Mankiewicz, 2010; Wiącek, 2008). There are also analyses of teacher competencies (Chrzanowska, 2018) and of the opportunities and barriers of inclusive education as seen by teachers (Chrzanowska, 2019). Studies and analyses of inclusive education also discuss, to a limited extent, the emotions that teachers experience at work and, more frequently, their job satisfaction (Blecker & Boakes, 2010; Cheng & Ren, 2010; Lalagka, 2017; Wiącek, 2008).
Based on a literature review, Mielniczuk and Łaguna (2018, p. 2) note that “the interest in affect in the organizational context is increasing, since there is growing evidence that emotional reactions are connected with rational decision making, as well as with health and different work outcomes”. Accordingly, new research reports are published that explain the share of emotions in job performance and describe the effects they cause (Baka, 2015; Laguna et al., 2017b; Laguna et al., 2021; Yang et al., 2020). Of the many concepts and methodologies for measuring work related affect, the most frequently used is Warr’s job-related affective well-being measure, which is designed to assess 4 types of affect at work: anxiety, comfort, depression, enthusiasm (Warr, 1990). The tool to describe emotions experienced in the workplace was extensively adapted by the international team led by Laguna (Laguna et al., 2017a, 2019; Mielniczuk & Łaguna, 2018). The results of their work prove that the model used in this study, namely the model with four correlated factors, representing anxiety, comfort, depression, and enthusiasm, had a superior fit compared to alternative models and that mean scores on the scales of the instrument can be meaningfully compared across genders, but not across countries.
Generally speaking, work contentment may be said to be an attitude. It means either the inner state or the individual’s impression of how good or bad the work they do is for them. Currently, job satisfaction measurements and analyses focus on two corresponding components, that is, emotional and cognitive aspects. What we refer to as job satisfaction constitutes the cognitive aspects of being content with one’s work. Emotional aspects are the emotional evaluation of work, one’s mood or frame of mind at work (Zalewska, 2003). Such understanding of job satisfaction is in line with the transactional model of subjective well-being proposed by Zalewska (2004), in which job satisfaction is treated as a category of overall life satisfaction. This model emphasizes the distinctiveness of the respective emotional and cognitive evaluation and it assumes that the qualities (resources) of a person modify the significance of inner and outer factors as well as the processing of emotional and cognitive information (Zalewska, 2009).
Job satisfaction is said to be the predictor of job performance (Park et al., 2021; Zalewska, 2004; Zhang & Zheng, 2009). The category of job satisfaction is gaining popularity in assessments of work contentment among teachers/educators in inclusive schools (Burns & Machin, 2013; Lalagka, 2017; Toropova et al., 2021; Wang et al., 2017), as well as in special schools (Platsidou & Agaliotis, 2008).
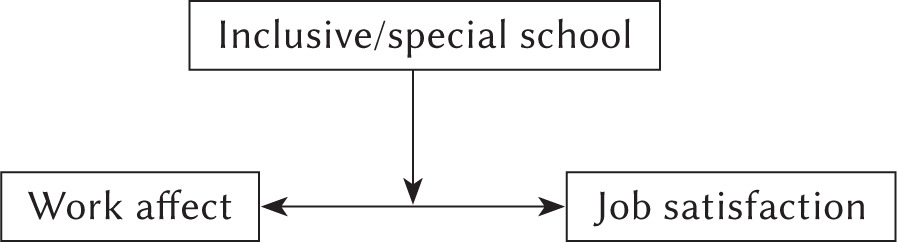
In this context, the main theoretical research model was based on the assumption that the type of an educational institution is the moderator of the correlation between work affect and job satisfaction (Figure 1).
The following main research question was asked: To what extent does the type of the educational institution (inclusive vs. special school) moderate the correlation between teachers’ work affect and job satisfaction?
Based on the state of knowledge, the following hypotheses were also made:
H.1. Positive work affect is positively and statistically significantly correlated with job satisfaction while negative affect is negatively and statistically significantly correlated with job satisfaction.
H.2. Work affect is a strong predictor of job satisfaction.
H.3. The type of the educational institution moderates the correlation between work affect and job satisfaction.
PARTICIPANTS AND PROCEDURE
PARTICIPANTS
The respondents were 214 teachers, half of them from mainstream schools and the other half from special schools; the majority of them (90.00%) were women. They worked in different school levels (primary schools, middle schools, high schools), mostly (84.10%) in large cities. The study included both beginner teachers (minimum age was 28 years) and teachers in the late stage of their professional career (maximum age was 62 years). The mean age of the inclusive school teachers and the special school teachers was M = 45.40 and M = 46.30, respectively. Years of service ranged from 4 to 38-40 years; the means were M = 19.83 and M = 21.38 (Table 1).
Table 1
Selected demographic characteristics
RESEARCH TOOLS
Two methods were used: the Work Affect Scale by Warr (1990) and the Satisfaction with Job Scale by Zalewska (2003). The respective groups were described using the author’s original demographic data survey.
The Work Affect Scale was adapted to the Polish context by Mielniczuk and Łaguna (2018). The scale consists of twelve emotions that describe the respondent’s mood in their workplace. Six of them are positive emotions (quiet, pleased, relaxed, joyful, enthusiastic, optimistic), and the other six are negative emotions (tense, anxious, upset, downcast, sombre, unhappy). The respondent is asked to specify how often they have experienced the above emotions at work in the last few weeks on the Likert-type scale from 1 (never) to 6 (always). The results enable overall evaluation of the positive affect/ negative affect indicator and the 4 types of affect at work: anxiety, comfort, depression, enthusiasm.
The Satisfaction with Job Scale (Zalewska, 2003) allows the cognitive aspect of overall job satisfaction to be measured. It consists of 5 statements rated by respondents on a 7-level scale from 1 (I strongly disagree) to 7 (I strongly agree). The result is the sum of scores for the 5 test items; the higher the score, the higher is the job satisfaction.
The internal reliability of the scale is high in the heterogeneous group; Cronbach’s α is .86. The scale shows high convergent validity with other measures of the cognitive aspect of job satisfaction and discriminant validity in relation to measures of emotional aspects of job satisfaction and to the cognitive aspect of overall life satisfaction (Zalewska, 2003).
DATA ANALYSES
Statistical analyses were performed using the SPSS software. The state of the analysed variables in the respective groups and subgroups was described using the mean, standard deviation and the distribution of frequency and percentages. The respective groups’ mean values were analysed using the t-test and correlations with Pearson’s r coefficient. The theoretical model of moderation was tested by means of Hayes’ (2017) macro PROCESS version 3.4.1.
RESULTS
DESCRIPTION OF THE VARIABLES IN THE RESPECTIVE GROUPS OF RESPONDENTS
The analysis of respondents’ emotions experienced in relation to their work in inclusive or special schools yields very interesting information. In general, their positive affect is much stronger than negative affect; the effect size is large (Table 2). The type of school is a significant differentiating factor only with respect to enthusiasm. The inclusive school teachers are much more enthusiastic about their work than those in special schools; in this case, too, the effect size is large (Table 3).
Table 2
Within-group differences between positive and negative affect
| M | SD | t | p | d | ||
|---|---|---|---|---|---|---|
| Inclusive schools | Positive affect | 24.32 | 4.94 | 14.83 | .001 | 8.15 |
| Negative affect | 12.64 | 4.12 | ||||
| Special schools | Positive affect | 23.09 | 5.57 | 10.39 | .001 | 9.36 |
| Negative affect | 13.59 | 5.08 |
Table 3
Differentiation with respect to job satisfaction and work affect between the respective groups
For the job satisfaction variable, it was noted that the job satisfaction is average for the responding teachers, both from inclusive schools and special schools. The mean values for the two groups are very similar: M = 25.69 and M = 25.41, respectively. Meanwhile, the type of educational institution is not a differentiating factor for the responding groups in terms of job satisfaction (Table 3). In general, it seems that the responding teachers do not see their job as close to the ideal, consider their working conditions to be average, and do not always manage to achieve the goals they set for themselves in the work they do at the moment.
An analysis of bilateral correlations between the work affect and job satisfaction variables confirmed an average positive correlation between job satisfaction and positive work affect (p ≤ .01) and positive emotions such as comfort (p ≤ .01) and enthusiasm (p ≤ .01), and an average negative correlation between job satisfaction and negative work affect (p ≤ .01) and negative emotion such as anxiety (p ≤ .01) and depression (p ≤ .01) in the mainstream school teachers group. In the group of special school teachers, the correlation indicators are slightly higher (Table 4).
Table 4
Correlation coefficients between job satisfaction and work affect and their significance
WORK AFFECT AND SELECTED DEMOGRAPHIC VARIABLES AS PREDICTORS OF JOB SATISFACTION
The predictive power of job satisfaction was tested with respect to work affect and selected demographic variables using linear regression analysis. The linear model proposed was statistically significant F(5, 206) = 16.89, p = .001 and explained 27.3% of the variance of the explained variable. Of all predictors considered, only positive affect proved to be a statistically significant predictor of job satisfaction (p = .001), with the relationship between these two variables being positive and moderate (β = .48): the higher the positive affect, the higher the job satisfaction (Table 5).
Table 5
Predictors of job satisfaction
| Job satisfaction | |||
|---|---|---|---|
| β | t | p | |
| Positive affect | .48 | 6.49 | .001 |
| Negative affect | –.09 | –1.28 | .200 |
| Gender | –.08 | –1.38 | .170 |
| Age | .14 | 1.02 | .310 |
| Years of service | .02 | 0.17 | .870 |
| R2 = .27, F(5, 206) = 16.89, p = .001 | |||
The regression model with positive affect as a predictor of job satisfaction is statistically significant, F(3, 103) = 5.70, p =. 001, and accounts for 14.2% of the variance of the explained variable. In contrast, the model of moderation is statistically non-significant, F(1, 103) = 0.42, p = .510, the β coefficient = .19 [CI: –.26, .51]. Therefore, the type of school does not change either the strength or the direction of the association between positive affect and job satisfaction (∆R2 = .00).
DISCUSSION
The goal of this study was to empirically verify the constructed theoretical model, to test the hypotheses and to describe the predictive scope of work affect on the level of job satisfaction among inclusive and special school teachers, and to determine the extent to which the type of an educational institution moderates the correlation between the studied variables.
The mean values of most variables are similar between teachers in inclusive and special schools; an exception is enthusiasm, which is felt more strongly by the inclusive school teachers. They also suggest that the positive affect (emotions: comfort, enthusiasm) are felt much more strongly than the negative affect (emotions: anxiety and depression). The mean results for job satisfaction of the responding teachers are average. Such distribution of the studied variables suggests that the responding teachers may avoid the high level of stress that is frequently reported in their professional group (Forlin, 2001) and the consequent occupational burnout (Burić et al., 2021; Tucholska, 2003).
The first two hypotheses – H.1: Positive work affect is positively and statistically significantly correlated with job satisfaction while negative affect is negatively and statistically significantly correlated with job satisfaction, and H.2: Work affect is a strong predictor of job satisfaction – were to a large extent confirmed. An analysis of the correlations proved the expected positive and negative correlations between the variables in each of the responding groups. The assumption that work affect is a strong predictor of job satisfaction scores in the responding groups was only confirmed for the positive affect. It may be stated that the domination of positive emotions in the responding teachers and the strong predictive value of those emotions with respect to job satisfaction may yield equally positive effects in job performance as the ones formerly described in studies on various employee groups (Baka, 2015; Bono et al., 2007; Brief & Weiss, 2002; Laguna et al., 2017b, 2021; Yang et al., 2020).
The last of the hypotheses – H.3: The type of an educational institution serve as a moderator in the work affect and job satisfaction correlation – was not confirmed. The type of an educational institution (inclusive vs. special school) does not moderate the correlation between work affect and job satisfaction.
The study has some limitations that need to be considered. One of them is associated with the unavailability of information about what types of disabilities pupils in inclusive and special schools had. Knowing that is important as teaching high-functioning pupils with motor disabilities is less demanding and stressful than low-functioning pupils with profound developmental disabilities. The locations of schools, which are unaccounted for in this study, should also be considered in future research. Schools in big cities tend to have better specialist teaching equipment than those in rural areas or small towns. The unavailability of such equipment may affect the level of job satisfaction felt by teachers. Also included in future research should be subjective assessments of the school environment made by pupils with special educational needs, as this approach is increasingly present in most recent published research reports (Rodríguez Gudiño et al., 2022; Toropova et al., 2021).
Positive work-related emotions and average and high job satisfaction felt by ca. 2/3 of the inclusive and special school teachers surveyed suggest that both these groups are ready for high-quality education for all (Candeias et al., 2021; Chrzanowska, 2019; Szumski & Firkowska-Mankiewicz, 2010).
An important implication of this study for the leadership of inclusive and special schools is that it underscores the importance of recognising teachers’ needs and responding to early signs of low job satisfaction, especially those arising from the poor organization of teamwork or the insufficiency of teaching aids.