BACKGROUND
Post-traumatic growth (PTG) is defined as “positive psychological change experienced as a result of the struggle with highly challenging life circumstances” (Tedeschi & Calhoun, 2007). Tedeschi and Calhoun (1996, 2007) consider PTG the positive outcome of struggling with a traumatic event, distinct from the negative outcomes related to psychological distress. The term “post-traumatic growth” was coined to capture the positive psychological changes witnessed by clinical psychologists among their patients who were coming to terms with highly stressful and challenging life events. In subsequent studies the focus has been on the transformational role that adversity can play in fostering growth (Joseph & Linley, 2008; Tedeschi & Calhoun, 2004). People frequently report such benefits following the experience of adversity. An early review of the literature found that among survivors of different traumas, 58% to 83% retrospectively reported experiencing growth following adversity (Joseph & Linley, 2008). The American Psychiatric Association Diagnostic and Statistical Manual of Mental Disorders – DSM-5 (APA, 2013) considers cancer a type of trauma that can lead to many challenges. Cancer-related challenges could trigger a negative or positive reaction with different intensities depending on individual characteristics. Whereas some have found that the prevalence rate of post-traumatic stress disorder (PTSD) in cancer survivors is equivalent to those without cancer (Bruce, 2006), others estimate that in patients undergoing treatments, the estimate of PTSD symptomatology ranges from 0% to 32% (Kangas et al., 2002; Marziliano et al., 2020). A recent 4-year follow-up study (Chan et al., 2018) showed that approximately 1 in 5 patients (21.7%) with cancer at the 6-month follow-up had PTSD.
In the literature, the role of various factors in contributing and mediating the relationship between the impact of trauma and PTG is subject to debate. Few data are available about coping strategies, perceived social support, and attachment style (Romeo et al., 2019). Tedeschi and Calhoun (2007) suggest that coping responses and cognitive processing to handle stressful events play a central role in the development of PTG. Resilience is a target of interest for PTG research as it has been cited as a key component which can manipulate the level of cognitive and affective processing engaged in by an individual following a trauma (Stanton et al., 2006). Resilience can be defined as an ability to recalibrate the personal worldview in relation to cognitions, emotions, beliefs and behaviors (Walsh et al., 2018). This, in turn, can facilitate flexibility which can aid some people in adapting following a traumatic experience (Walsh, 1998; Walsh et al., 2018). Data about resilience and PTG in the cancer population are poor and unclear. Carver (1998) and Aldwin (1994) argued that resilience is characterized by mere homeostatic return to a previous condition, whereas in PTG there is an improvement with respect to previous conditions. Aldwin (1994) also argued that research on resilience has focused more on the ability to maintain skills in adverse conditions rather than on the acquisition of potential benefits. In recent data, the role of resilience in predicting outcomes in a variety of areas such as distress and quality of life has been described in cancer patients (Walsh et al., 2018).
Although post-traumatic stress symptoms and PTG are more often studied separately, both empirical and non-empirical research on the relationship between these constructs are accumulating. A recent meta-analysis demonstrated a modestly positive and robust relationship between growth and stress in cancer populations. Most (n = 36) of the 51 empirical studies used in the analysis indicated that there was a positive relationship between growth and stress. Another important finding is that PTSD and PTG are more strongly related in individuals with stage IV cancer, fitting the explanation that the more an event is perceived as threatening, as is the case with stage IV disease, the more one individual becomes involved in the rapid, cyclical process of growth and stress, leading to a stronger relationship between the two constructs (Spiegel, 1999). According to Hill and Watkins (2017), PTG is related to lower pain, higher quality of life, greater overall well-being, and longer life expectancy among cancer patients. A study by Gori et al. (2021) explored the effects of resilience on PTG, in a group of 154 cancer patients, finding a determinant role of resilience in PTG, in line with other researchers (Dong et al., 2017).
Over the past two years, the COVID-19 pandemic has exposed cancer patients to a higher level of stress and a greater risk of developing psychological disorders, such as anxiety, depression (Savard et al., 2021; Turgeman et al., 2022) sleep difficulties (Giotta et al., 2020; Savard et al., 2021; Steel et al., 2022) and PTSD (Marano et al., 2021). It appears that anxiety disorders may result from a sense of loneliness (Steel et al., 2022), fear of being exposed to the virus during hospital treatment, and receiving a worse prognosis (Marino et al., 2022).
Furthermore, some studies show how these difficulties can develop regardless of the type of cancer diagnosed, while according to Turgeman et al. (2022), cancer types associated with higher suffering scores are specifically breast, melanoma, head and neck, gastrointestinal, genitourinary, and lung ones.
Closeness and emotional support are confirmed as fundamental in activating the process of awareness (Marano et al., 2021), in improving the well-being and in reducing the discomfort, both in ordinary and extraordinary times (Giotta et al., 2020). Research has shown how the way of reacting to one’s own state of health and positive personal resources can directly influence the prognosis of disease (Marano et al., 2021) and resilience. Resilience, fostered by individual optimism, hope, self-efficacy, courage and awareness of traits, acts as a protective factor against the development of anxiety, stress and depression, preventing psychological distress despite exposure to COVID-19 and the time of diagnosis (Chiesi et al., 2022).
The aim of this study is to evaluate relationships between PTG, trauma of cancer, COVID-19 pandemic related stress, PTG and resilience over time.
PARTICIPANTS AND PROCEDURE
PARTICIPANTS
The research concerned 146 oncological patients belonging to: Gynecologic Oncology, Radiotherapy, Oncology, and Breast Cancer Center Departments of Fondazione Policlinico Universitario A. Gemelli IRCCS. All patients were assessed by the psycho-oncologists of the Clinical Psychology Unit. Inclusion criteria were age ≥ 18 years; patients undergoing oncological treatments (chemotherapy, hormone therapy, radiotherapy, other treatments) or not undergoing oncological treatments; ability to understand and sign informed consent.
The mean age was 53.60 ± 11.70 (range = 20-78). Nine patients dropped out and 7 died, so 130 patients completed the whole project in three different times (see Table 1 for demographic characteristics).
Table 1
Characteristics of the sample
A prospective longitudinal study with a duration of 18 months was performed with the following self-administered measures with an assessment duration of 45 minutes, at baseline (T0), after 6 months (T1) and after 12 months (T2).
This study was performed in line with the principles of the Declaration of Helsinki. The research protocol was approved by the Ethical Committee of Fondazione Policlinico Universitario A. Gemelli IRCCS (approval number 0027036/20). All the patients in the study were informed about the study and their written informed consent was obtained.
PSYCHOLOGICAL PROFILE
Distress Thermometer (DT; Keir et al., 2008) to evaluate emotional distress. The Distress Thermometer is a visual analogue tool rating personal distress during the past week on a scale from 0 (no distress) to 10 (extreme distress). A DT cut-off score ≥ 4 identifies patients with emotional distress (‘distressed patients’).
The Hospital Anxiety and Depression Scale (HADS; Zigmond & Snaith, 1983) is a well validated and reliable self-reported measure designed to identify the presence and severity of anxiety and depression in cancer patients. HADS is a brief 14-item scale to report patients’ symptoms during the previous week. HADS is divided into anxiety (HADS-A) and depression (HADS-D) subscales. Higher scores on either of the two subscales indicate more severe symptoms. Global scores of 0-7 are classified as normal; 8-10 as mild; 11-14 as moderate; and 15-21 as severe. A global score ≥ 16 indicates anxiety/depression (‘anxious/depressed patients’).
Symptom Checklist-90 (SCL-90-R) to evaluate psychopathological symptoms (Prunas et al., 2012). The SCL-90-R is a self-report 90-item psychometric instrument that objectively evaluates a broad range of psychopathological symptoms. It measures nine symptom dimensions, i.e. somatization, interpersonal sensitivity, obsessive-compulsive symptoms, depression, anxiety, hostility, phobic anxiety, paranoid ideation, and psychoticism, as well as a class of additional items that assess other aspect of symptoms; it can provide an overview of a patient’s psychological symptoms and their intensity at a given time point.
SUBJECTIVE RESPONSE TO A TRAUMATIC EVENT (PTSD)
Impact of Event-Scale Revised (IES-R; Craparo et al., 2013; Weiss & Marmar, 1997). The IES-R is a 22-item self-report measure of current subjective distress in response to a specific traumatic event. It comprises three subscales representative of the major symptom clusters of post-traumatic stress, capturing the DSM criteria for PTSD: intrusion (intrusive thoughts, nightmares, intrusive feelings and imagery, dissociative-like re-experiencing), avoidance (numbing of responsiveness, avoidance of feelings, situations, and ideas), and hyper-arousal. Respondents are asked to identify a specific stressful life event and then indicate how much they were distressed or bothered during the past seven days by each “difficulty” listed. While there is no specific cut-off score, scores higher than 24 are of concern; the higher the score, the greater the concern for PTSD and associated health and well-being consequences.
STRESS (COVID-19 PANDEMIC RELATED)
Perceived Stress Scale (PSS; Cohen et al., 1983; Cohen & Williamson, 1988). The Perceived Stress Scale is the most widely used psychological instrument for measuring the perception of stress. It is a measure of the degree to which situations in one’s life are appraised as stressful. Items were designed to tap how unpredictable, uncontrollable, and overloaded respondents find their lives. The scale also includes several direct queries about current levels of experienced stress.
POST-TRAUMATIC GROWTH
The Post-traumatic Growth Inventory (PTGI; Prati & Pietrantoni, 2014; Tedeschi & Calhoun, 1996) is a self-report instrument of positive changes after a traumatic experience. It comprises 21 items rated on a 6-point Likert-type scale and organized in five subscales: Relating to Others (PTGI 1), New Possibilities (PTGI 2), Personal Strength (PTGI 3), Spirituality (PTGI 4), and Appreciation of Life (PTGI 5). The total PTG score ranges from 0 to 105, with high scores indicating positive growth. The PTGI has been used appropriately in previous studies with cancer patients (Chan et al., 2018; Soo & Sherman, 2015). It shows an excellent total internal reliability (Cronbach’s α = .93), and one acceptable to high internal reliability for each factor (Cronbach’s α range .74-.86) (Prati & Pietrantoni, 2014).
RESULIENCE
The Connor-Davidson Resilience Scale (CD-RISC; Connor & Davidson, 2003) consists of 25 items based on how patients have felt in the past month on a five-point Likert scale ranging from 0 (not true at all) to 4 (true nearly all of the time). Scoring of the scale is based on summing the total of all items, each of which is scored from 0 to 4. The full range is therefore from 0 to 100, with higher scores reflecting greater resilience.
The timing of tests’ administration is depicted in Table 2.
Table 2
Psychological dimensions to investigate and tests adopted
| Tests | T0 | T1 | T2 | |
|---|---|---|---|---|
| Clinical psychological | DT | ✓ | ✓ | ✓ |
| profile | HADS | ✓ | ✓ | ✓ |
| SCL-90-R | ✓ | ✓ | ✓ | |
| PTSD | IES-R | ✓ | ✓ | |
| Impact of COVID-19 on stress | PSS | ✓ | ✓ | |
| Post-traumatic growth | PTGI | ✓ | ✓ | ✓ |
| Resilience | CD-RISC | ✓ | ✓ | ✓ |
[i] Note. DT – Distress Thermometer; HADS – Hospital Anxiety and Depression Scale; SCL-90-R – Symptom Checklist-90; IES-R – Impact of Event-Scale Revised; PSS – Perceived Stress Scale; PTGI – Post-traumatic Growth Inventory; CD-RISC – Connor- Davidson Resilience Scale; PTSD – post-traumatic stress disorder.
SAMPLE SIZE AND STATISTICAL ANALYSIS
Given the descriptive purpose of the study, no formal sample size calculation was made. However, considering the average number of patients that are followed in our hospital annually (lung 300, breast 1000, gynecological neoplasms 1300, prostate 100, colorectal 170), and considering an expected 10% of patients who will meet the exclusion criteria, we decided to include 90 patients for each tumor site considered (lung, breast, gynecological neoplasms, prostate, colorectal), resulting in a total of 450 patients expected to be included in this study. This sample should have ensured a 95% power to detect significant differences of PTG over time in the subgroup analysis. Power calculation was made using G*Power software (release 3.1.9.4). Unfortunately, due to the reduction in the number of new patients on the waiting list for treatments due to the pandemic, the ideal sample size was not reached.
The statistical operations were carried out through the software IBM SPSS Statistics 28. To identify the sample, descriptive statistics (mean and SD) and frequency analysis of socio-demographic variables were carried out. For the identification of significant differences between the measurements analyzed at two times (T0-T1), the paired samples t test was used. In addition, the repeated measures ANOVA test was used to identify significant differences between the measurements analyzed three times (T0-T1-T2). To highlight the presence of any significant correlations between the investigated scales, correlations with Pearson’s r were carried out. Significance was set at p < .05.
RESULTS
T2 T TEST PAIRED FOR T0 AND T2
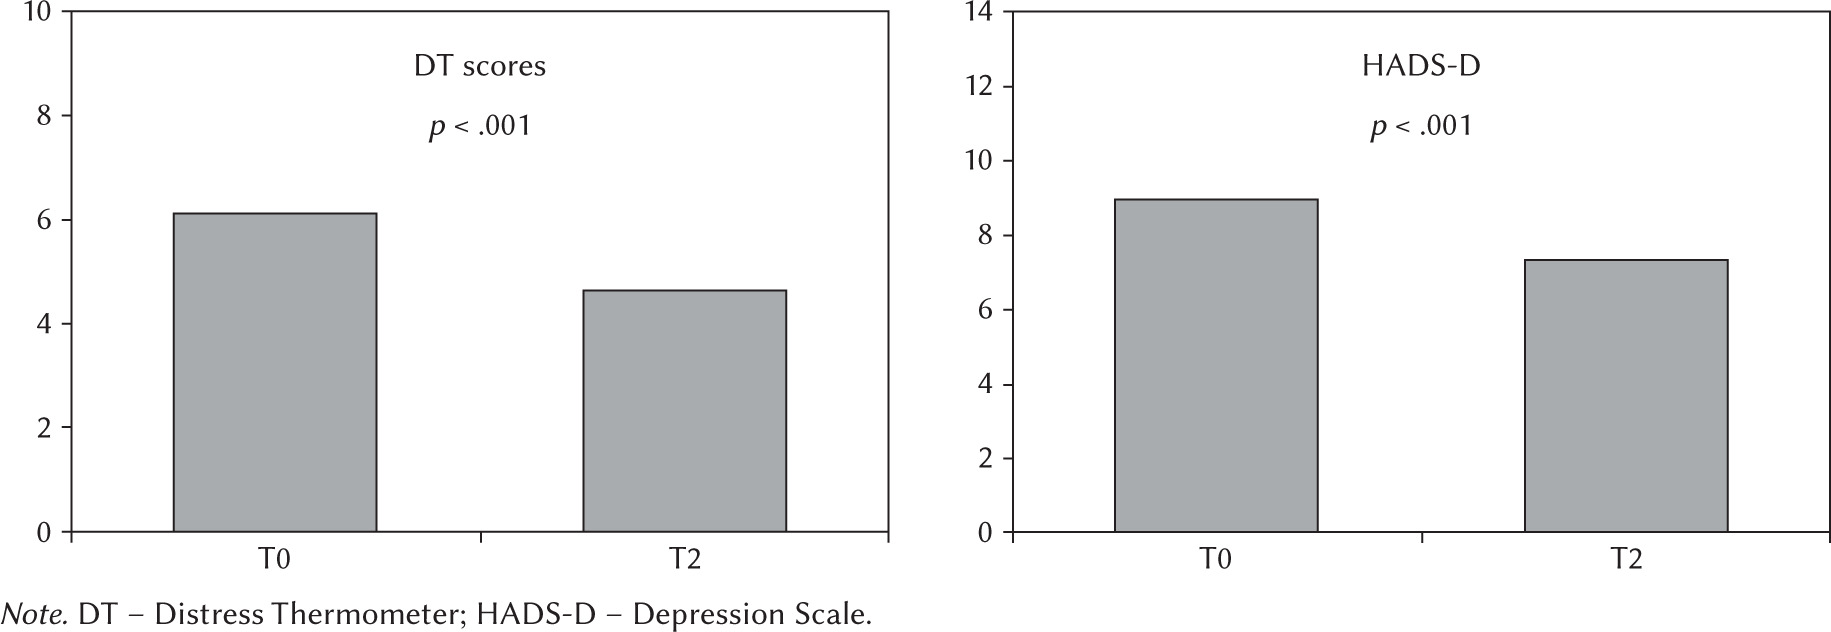
The results showed a significant decrease in DT (p < .001) and HADS-D scores (p < .001) (Table 3). Figure 1 shows the comparison of their means.
Table 3
T-test paired for Time 0 (T0) and Time 2 (T2)
[i] Note. DT – Distress Thermometer; HADS A – Anxiety Scale; HADS D – Depression Scale; CD-RISC – Connor-Davidson Resilience Scale; PSS – Perceived Stress Scale; PTGI 1 – Post-traumatic Growth Inventory – Relating to Others; PTGI 2 – Post-traumatic Growth Inventory – New Possibilities; PTGI 3 – Post-traumatic Growth Inventory – Personal Strength; PTGI 4 – Post-traumatic Growth Inventory – Spirituality; PTGI 5 – Post-traumatic Growth Inventory – Appreciation of Life; PTGI TOT – Post-traumatic Growth Inven- tory – Total; T GSI – SCL-90-R Global Score Index; T PST – SCL-90-R Positive Symptom Total; T PSDI – SCL-90-R Positive Symptom Distress Index; T SOM – SCL-90-R Somatization; T O-C – SCL-90-R Obsessive-Compulsive Symptoms; T INT – SCL-90-R Interpersonal Sensitivity; T DEP – SCL-90-R Depression; T ANX – SCL-90-R Anxiety; T HOS – SCL-90-R Hostility; T PHOB – SCL-90-R Phobic Anxi- ety; T PAR – SCL-90-R Paranoid Ideation; T PSY – SCL-90-R Psychoticism; IES1 – IES- R Intrusion; IES2 – IES-R Avoidance; IES3 –IES-R Hyper-arousal; IES4 – IES-R Total mean.
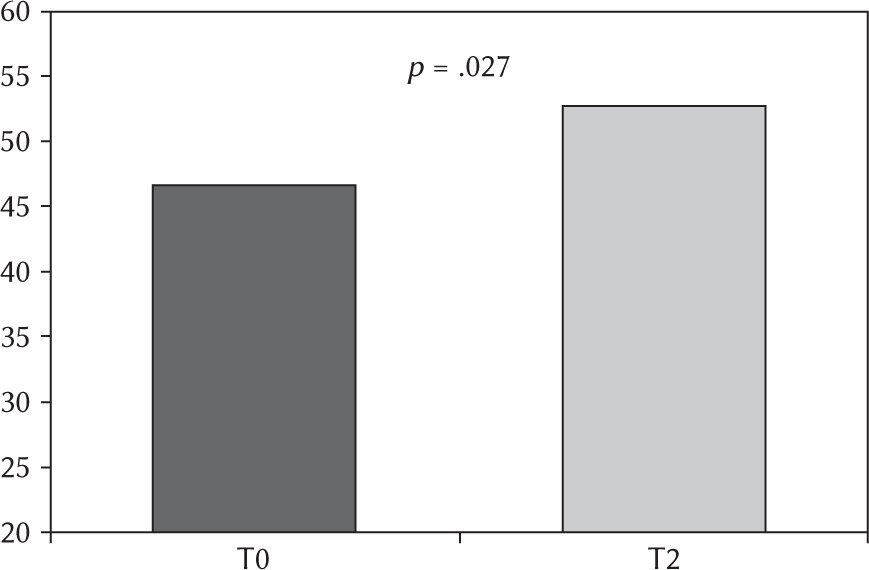
A significant increase was observed in PTGI total score (p = .027) (Figure 2), and in PTGI subscales New Possibilities (p = .029) and Appreciation for Life (p = .013) (Table 3). The comparison between the means obtained at T0 and T2 concerning PTGI total and each PTGI sub-scale scores is shown in Figure 3.
Figure 2
Comparison between the means obtained at T0 and T2 of the Post-traumatic Growth ventory and its subscales
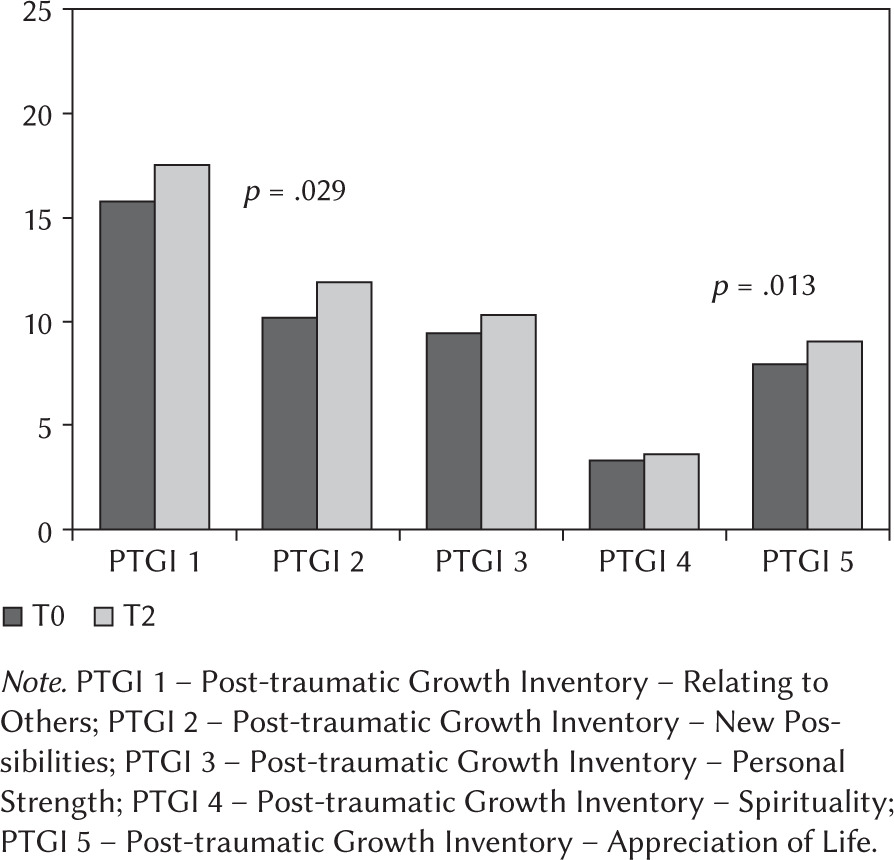
Figure 3
Comparison between the means obtained at T0 and T2 of the Post-traumatic Growth I ventory total score
A significant decrease in the scores of the IES-R Avoidance scale was detected (p = .035).
REPEATED MEASURES BY ANOVA FOR T0, T0, T1 AND T2
The results showed (Table 4) that there was a significant difference between the measurements in the three different times of the DT (p < .001). Post hoc comparisons made it possible to detect a significant difference between the measurements made at T0 and T1 (p = .021), between T1 and T2 (p = .012) and between T0 and T2 (p = .021).
Table 4
Repeated measures by ANOVA for Time 0 (T0), Time 1 (T1) and Time 2 (T2)
[i] Note. F – Fisher’s test; DoF – degrees of freedom; DT – Distress Thermometer; HADS A – Anxiety Scale; HADS D – Depression Scale; CD-RISC – Connor-Davidson Resilience Scale; PSS – Perceived Stress Scale; PTGI 1 – Post-traumatic Growth Inventory – Relating to Others; PTGI 2 – Post-traumatic Growth Inventory – New Possibilities; PTGI 3 – Post-traumatic Growth Inventory – Personal Strength; PTGI 4 – Post-traumatic Growth Inventory – Spirituality; PTGI 5 – Post-traumatic Growth Inventory – Appreciation of Life; PTGI TOT – Post-traumatic Growth Inventory – Total
A significant difference was observed between the three measurements of the HADS-D scale (p < .001). Post hoc comparisons detected a significant difference between T0 and T2 (p < .001) and between T1 and T2 (p < .001).
Regarding PTGI, the results showed that there was a significant difference between three different measurements in the Post-traumatic Growth Inventory subscales:
Relating to Others post hoc comparisons detected a significant difference between the measurements made at T0 and T1 (p = .011), and between T0 and T2 (p = .048).
New Possibilities post hoc comparisons detected a significant difference between the measurements made at T0 and T1 (p = .003) and between T0 and T2 (p = .025).
Personal Strength post hoc comparisons detected a significant difference between T0 and T1 (p < .001).
Change in Spirituality post hoc comparisons detected a significant difference between T0 and T1 (p < .002).
Appreciation for Life post hoc comparisons detected a significant difference between the measurements made at T0 and T1 (p < .001) and between T0 and T2 (p = .014).
Total post hoc comparisons detected a significant difference between the measurements made at T0 and T1 (p < .001) and between T0 and T2 (p = .020).
CORRELATIONS
We performed a Pearson correlation test to evaluate the relationship between PTG and the other variables. No correlation was found between PTGI and oncological treatment and cancer type. All PTGI subscales were correlated with resilience at T0; at T1 all the subscales except for Relating to Others were correlated with resilience. At T2 only the Spiritual Change subscale was related to resilience (see Table 5). Disease status was directly related to PTG: patients with no evidence of disease at T2 (NED) showed a positive correlation with total PTG score, p = .003. In contrast, patients with disease progression (PD) had a negative correlation with total PTG (p = .010). At T0 IES-R had a negative correlation with CD-RISC (p = .002).
Table 5
Pearson’s correlation between resilience and post-traumatic growth
RELIABILITY ANALYSES
In order to verify that the instruments used in the study were indeed valid and reliable, reliability analyses were conducted by calculating Cronbach’s α.
The reliabilities obtained at all three administration times (T0, T1 and T2) are presented below.
At T0, it is possible to appreciate how the instruments used, such as HADS, IES-R, CD-RISC, PTGI and SCL-90-R, present adequate reliability with a Cronbach’s α value greater than 0.90. Furthermore, the reliability of the PSS, whose Cronbach’s α value is .82, is acceptable.
At T1, it is possible to appreciate how the instruments used, such as CD-RISC and PTGI, present excellent reliability with a Cronbach’s α value of .92 and .94 respectively. The reliabilities of the HADS and PSS were also good, with Cronbach’s α values of .89 and .86 respectively.
At T2, the instruments used were equally reliable. In particular, HADS, IES-R and SCL-90-R show very good reliability, with Cronbach’s α greater than .90. The reliabilities of CD-RISC, PSS and PTGI are slightly lower, although acceptable, with Cronbach’s α values of .90, .72 and .67 respectively.
In summary, it can be appreciated that all the instruments used in the three time periods in which the study was carried out maintained adequate reliability.
DISCUSSION
The COVID-19 pandemic has had several effects on psychological and social aspects worldwide, and – as we unfortunately knew – it has also had effects on oncological patients who were involved in a complex reorganization process associated with high perceived stress, with to psycho-physical problems related to their health conditions (Fedele et al., 2021). A qualitative study of Savard et al. (2021) on cancer patients underlined that patients feel that contracting COVID-19 could highly increase their risk of poor outcomes and mortality and experience a sense of loss for all the things that the COVID-19 pandemic stole from them, in addition to what the cancer had already stolen. A recent study conducted by Moraliyage et al. (2021) analyzed cancer patients’ emotions on social media during the whole pandemic and found that the prominent emotion expressed was “fear” with just occasional spikes of positivity coincident with the development of treatments for COVID-19.
Despite the difficulties of the pandemic scenario, and any negative implications for oncological patients, in our sample we observed an improvement in distress and development of PTG similar to what has been observed in the literature concerning other diseases (Gori et al., 2021; Hamdan et al., 2022). As observed in other studies (Chiesi et al., 2022), resilience and PTG are positively correlated, showing how the presence of adaptive and psychological recovery strategies could improve the ability to transform a traumatic event into a resource. Similarly, as observed by Gori et al. (2021), the greater the tendency of patients to avoid illness-related trauma through dysfunctional psychological strategies is, the lower is the PTG.
Concerning our sample, we did not observe PTSD, although patients were all being confronted with a cancer diagnosis. This unexpected finding could be related to avoiding strategies implemented by patients to deal at the same time with the disease and the pandemic: this could almost indicate that patients – doubly committed to survival – defensively tended to minimize the impact of cancer.
Our study did not find any relevant change in the perceived stress concerning COVID-19 from the diagnosis to 12-month evaluation. The PSS score retained almost the same value over time: this seems to be consistent with the development of the pandemic, considering that patients were enrolled at the full pandemic time, when vaccination was not yet available. As we found in the literature, the COVID-19 stress related level significantly decreased over time after getting vaccinated (Zheng et al., 2021). To better understand the impact of COVID-19 on psychological health, we can refer to an article by Taylor et al. (2020), in which the authors observed that the distress linked to the whole pandemic situation was in any case significantly more debilitating than having contracted the virus itself. Concerning psychological symptoms scales, detected by SCL-90, no significant changes were detected in the entire sample over time: scores confirm the absence of psychopathologies frameworks at T0 and at T2.
Currently, a few studies on PTG during the COVID-19 pandemic are ongoing. Our study found relevant PTG during the first 6 months after the diagnosis, aligned with another study (Husson et al., 2017) which found PTG at 6-month follow-up in a group of adolescents and young adults affected by cancer. Another study conducted by Van der Hallen and Godor (2022) focalized the attention on the PTG subsequent to the COVID-19 pandemic, which determined an increase of changes in terms of practical and emotional skills, such as video conferencing, smart working (PTGI; New Possibilities), promoting the ability to connect with others (PTGI; Relating to Others), re-evaluation of one’s abilities to do this (PTGI; Personal Strength) and increasing the level of gratitude for one’s life in the context of a global pandemic (PTGI; Appreciation of Life).
Our study shows a significant reduction over time in distress and depressive symptoms. This is in line with another study (Chieffo et al., 2021) which investigated distress, anxiety and depression in oncological patients, showing that a high percentage of them (82%) had clinically relevant distress, anxiety and depressive symptoms at diagnosis. These symptoms decreased over time from T0 to T1 in distress, anxiety and depression (repeated measures outcome after 1 month).
If we consider the temporal evolution of the parameters of our interest, we can observe how the improvement of depressive symptoms is concentrated in the second semester following the diagnosis and not in the first six months. We can interpret this taking into account the fact that, in about 60% of our patients, the disease was in remission or was in a condition of relative stability, an aspect that, associated with the physiological and gradual psychological adaptation that can occur with the passage of time, can help relieve depressive reactions.
In line with different studies, our patients showed a positive correlation between PTG and resilience, and an inverse correlation between PTG and impact of trauma (Shi et al., 2022). As reported in a recent study by Shi et al. (2022), cancer patients may experience positive changes and psychosocial growth, such as the development of PTG, including an increased appreciation of life, greater sense of personal strength and self-understanding, renewed appreciation for intimate relationships, and positive spiritual changes. Similarly, our data show a specific positive correlation between resilience and the areas of appreciation for life and interpersonal relationship of PTG. Furthermore, in all areas where significant improvement was observed one year after diagnosis, i.e. total PTG, Relating to Others, New Possibilities and Appreciation for Life, improvement manifests itself in the first six months (in none of the dimensions of the PTG considered is there an increase in the statistical value in the surveys carried out between six and twelve months from diagnosis). These data seem to indicate that after the initial impact of the tumor, the first six months following the diagnosis are decisive for the activation of PTG. In particular, PTG seems to be related to resilience and, at the same time, to coping strategies characterized by reflection and confrontation with painful thoughts, affects and experiences related to the diagnosis of disease. Resilient patients might consider the trauma of their disease as an opportunity for personal growth and development and thus they experience more PTG.
However, this study also has some limitations. They are related to our study design: a multicentric approach may produce more significant data. Additionally, only a small number of patients with specific pathologies participated in this research, with respect to the expected sample.
It was also difficult to clearly distinguish the impact of the cancer diagnosis from the psychological effect of the COVID-19 pandemic. This seems to partially confirm other studies in the literature describing the relative lack of interest in the COVID-19 pandemic when a diagnosis of cancer has been received (Magno et al., 2020).
Another possible bias could be related to tests’ improvement due to spontaneous psychological evolution associated with disease remission rather than to psychological aspects associated with PTG.
CONCLUSIONS
Cancer diagnosis can be accompanied by various levels of psychological suffering, but for some patients the tumor experience can also be characterized by the presence and growth of generative aspects, such as the tendency to positively reconsider the value and importance of life, health and social relationships. Our data suggest that, despite the disorientation and uncertainty of the early phase of disease, the tendency to positively reconsider the fundamental values of life is a process that, in some circumstances, starts in the first six months after the cancer diagnosis. If the traumatic impact can not only be reduced but lead to an improvement over time of some behavioral and affective characteristics, the data seem to suggest that psychological variables are not only linked to invariant and structural personality characteristics of the individual but can be adequately stimulated by timely psychological support that takes into account patients’ needs. Further investigations are needed to apply these results to clinical practice and to realize the best personalized support for the cancer patient.